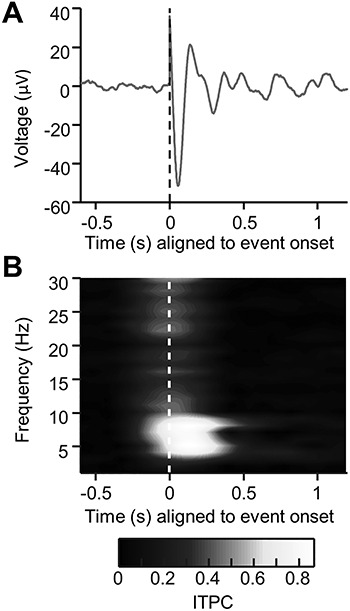
Figure 4.

Theta phase-reset simulation. (A) An ERP generated by simulating a theta-band phase-reset mechanism (see Methods section). Phase was reset to a preselected phase (in this case, to  or 144°). Notice the sharp, high-frequency transient that is present in the ERP at time t = 0 despite being generated using a low-frequency phase-reset mechanism. (B) The intertrial phase clustering of the same simulated data as in (A). Notice that despite the mechanism of the response being a low-frequency reset, broadband phase concentration is seen, suggesting that high-frequency transients in the data can skew intertrial phase clustering metrics to show artificial, high-frequency phase clustering that is not present in the underlying data.
