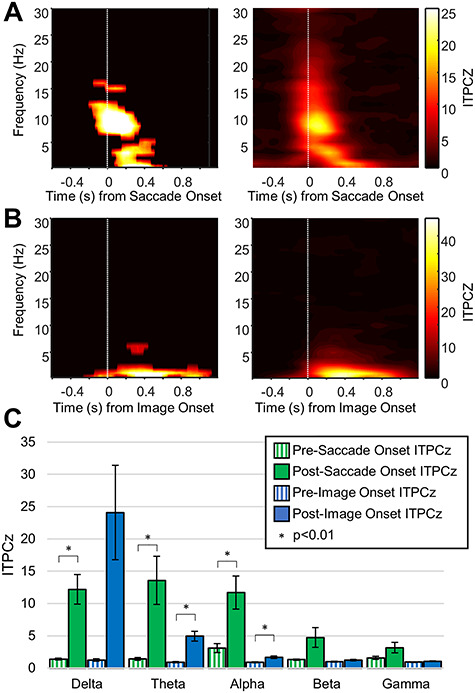
Figure 5.

Intertrial phase clustering (ITPC) for hippocampal electrodes. (A) Left—Representative ITPCz for ICA-filtered saccade-aligned epochs. The plot has been masked to indicate significant values (see Methods for details). Right—Grand-average ITPCz value for ICA-filtered saccade-aligned epochs for all hippocampal electrodes. Note the obvious phase clustering in the delta, theta, and alpha frequency bands. (B) Same as A but for image-onset–aligned epochs. Notice that the phase clustering is limited to lower frequency bands and has a longer time course. (C) Comparison of ITPCz values for different time-frequency windows in the pre- and post-event periods (see Table 2). Significant differences are marked with an asterisks.
