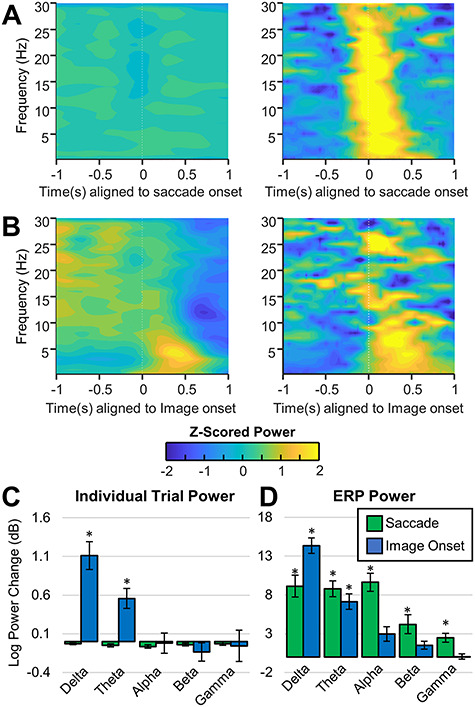
Figure 6.

Spectral power for saccade-onset and image-onset epochs for hippocampal electrodes. A and B show power spectrograms in which the power for each frequency has been z-scored to better visualize power changes within each frequency. (A) Left, average power of ICA-filtered individual saccade-aligned epochs across all hippocampal electrodes. Right: Average power of ICA-filtered saccade-aligned ERPs averaged across all hippocampal electrodes. Notice that despite the significant increase in broadband power observed in the saccade ERPs, there is no observable increase in power in the individual trials. (B) Left, average power of individual image-onset–aligned epochs across all hippocampal electrodes. Right: Power of image-onset–aligned ERPs averaged across all hippocampal electrodes. Note that there is an observable increase in delta band and theta band power in the ERP and in the individual trials following image-onset. (C) Average log power change ( between pre- and post-event time-frequency windows (see Method details for definition of the time-frequency windows). Significant differences are indicated with an asterisks. Notice that there is no significant change in the power following saccade onset, but there is a significant increase in the power of the individual trials in the delta and theta bands following image-onset. (D) Same as C but for the power of the ERP. Note that in the ERPs, there is a significant increase in broadband power following saccade onset and a significant increase in lower frequency power (delta and theta) following image-onset.
