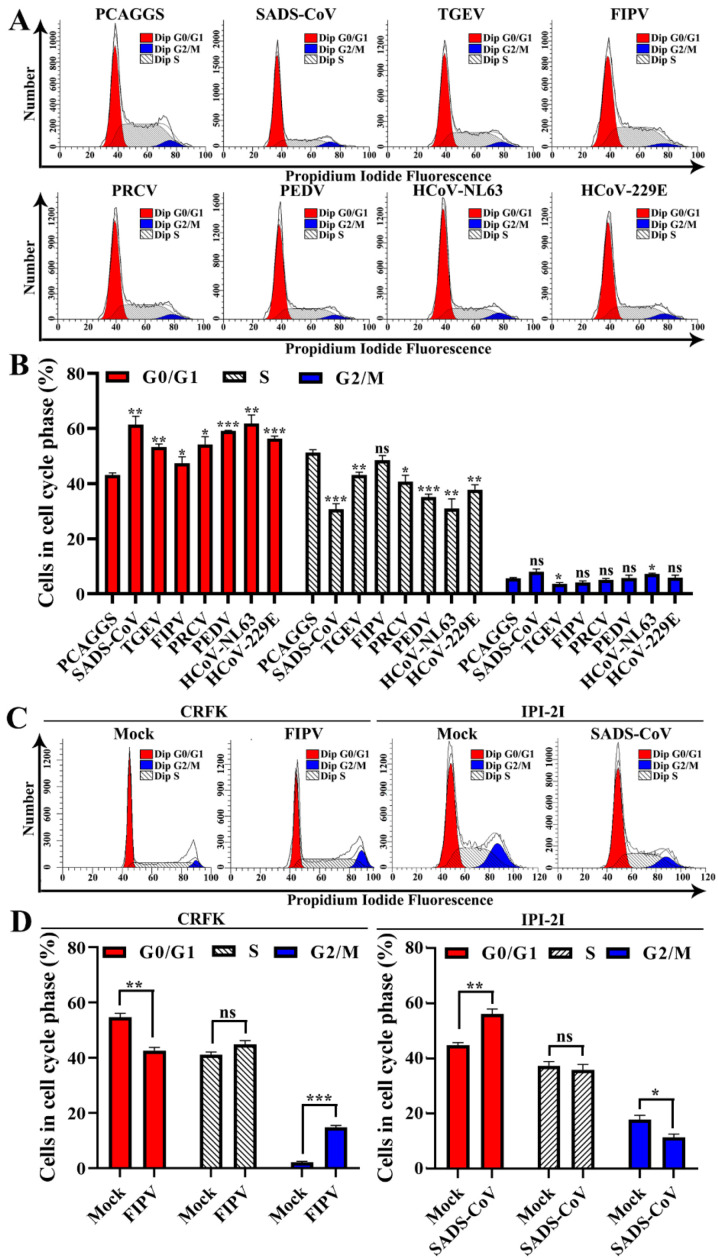
Figure 8.
Effects of α-CoV nsp1 on the HEK-293T cell cycle. (A) 293T cells transfected with an empty vector or α-CoVs nsp1 vector for 24 h were fixed, stained with PI in the presence of RNase A, and analyzed by flow cytometry to determine the DNA content and the cell population distributions in the various cell cycle phases. (B) The statistical result is relative to figure A. (C) CRFK cells infected 0.1 MOI FIPV for 12 h or IPI-2I cells infected 0.1 MOI SADS-CoV for 24 h were fixed, stained with PI in the presence of RNase A, and analyzed by flow cytometry to determine the DNA content and the cell population distributions in the various cell cycle phases. (D) The statistical result is relative to figure C. Data are represented as means ± SEM (n = 3). The values were calculated and differences were considered for p < 0.05 (Kruskal Wallis test). Ns: Not significant; *, p < 0.05; **, p < 0.01; and ***, p < 0.001.

