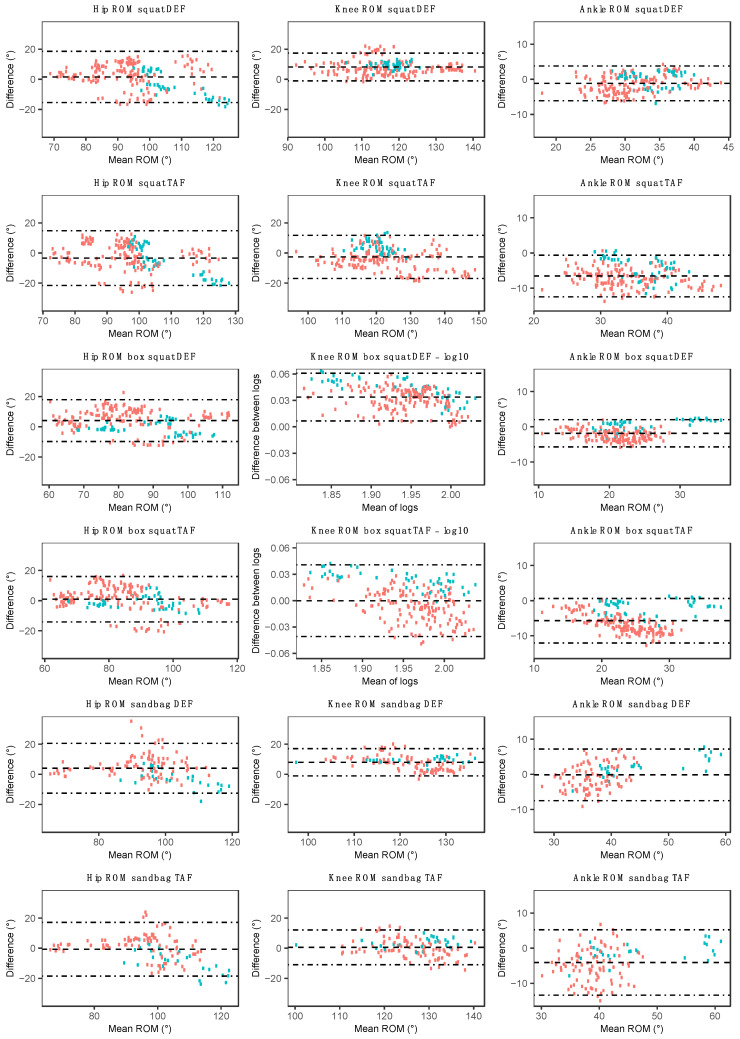
Figure 6.
Bland–Altman plots for hip, knee, and ankle range of motion (ROM) using each MARG method (DEF/TAF) during the squat (row one/two), box squat (row three/four), and sandbag pickup (row five/six). Red data points represent male participant data, and green data points represent female participant data.

