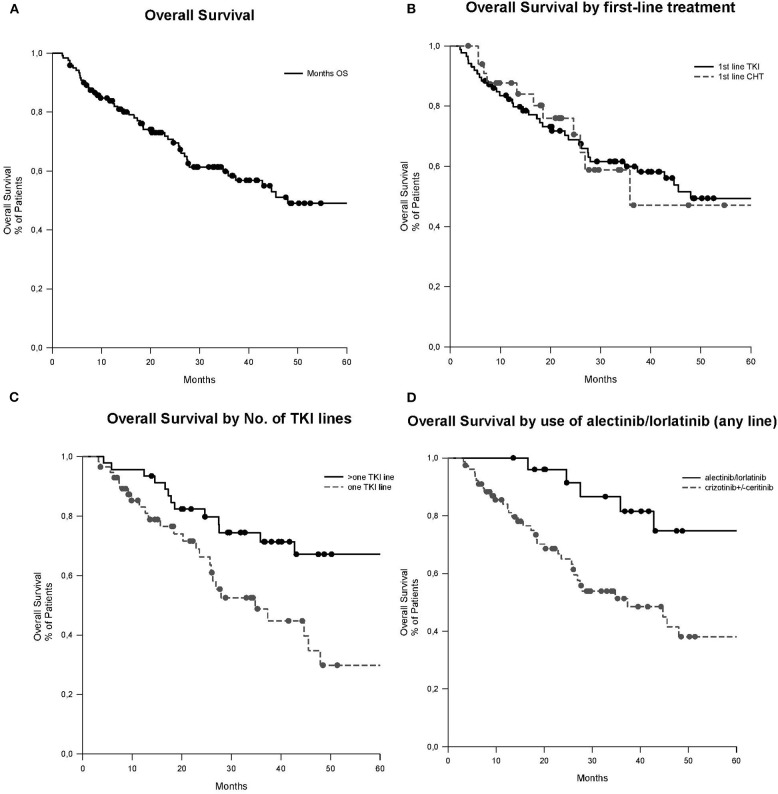
Figure 1.
OS curves (median follow-up of 39.5 months, 95% CI: 32.1–77.7). (A) OS of all patients, median 48.0 months (95% CI: 12.9–83.0). (B) OS according to the first-line of treatment, first-line TKI median 35.8 months (95% CI NA) vs. first-line ChT 48.0 months (95% CI: 11.8–84.1) (p = 0.955). (C) OS according to the number of lines of TKIs, >one line of TKIs median 85.7 months (95% CI: 63.9–107.5) vs. one line of TKI 34.8 months (95% CI: 21.6–48.0; p = 0.016). (D) OS according to the use of alectinib or lorlatinib in any line. Alectinib/lorlatinib median 85.7 months (95% CI: 64.0–107.5) vs. crizotinib ± ceritinib 37.3 months (95% CI: 16.1–58.6; p = 0.022). ChT, chemotherapy; CI, confidence interval; NA, not assessable; No., number; OS, overall survival; TKI, tyrosine kinase inhibitor.

