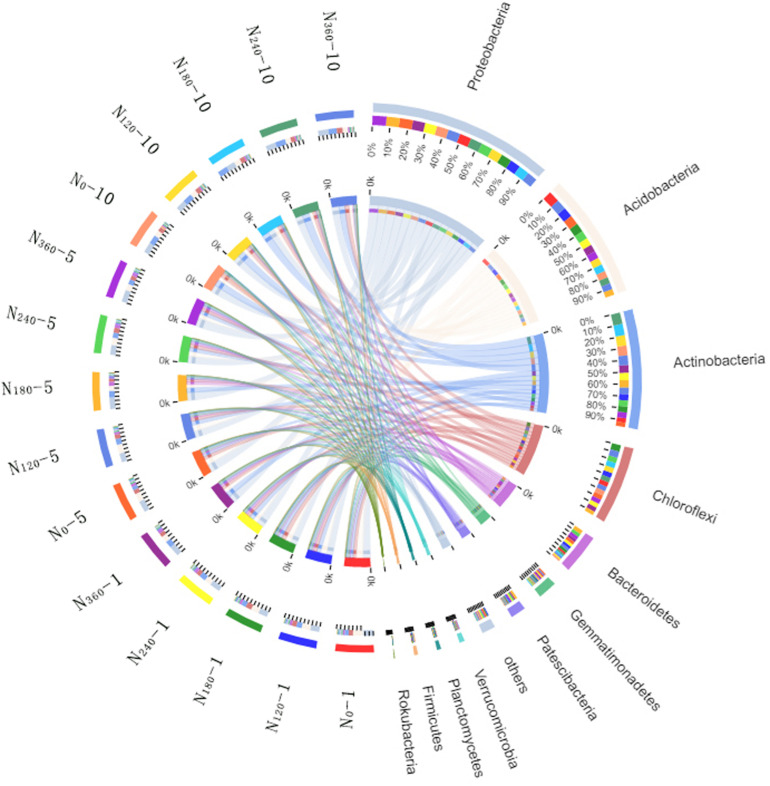
FIGURE 3.
Proportions of the dominant bacterial phyla in different treatment samples. N0-1, N0-5, and N0-10 represent the first, fifth, and 10th year of the 0 kg N hm–2 treatment, respectively. A similar notation has been used for the other fertilizer treatments. In the relation diagram between the Circos sample and species, the small semicircle (left half circle) represents the species composition in the sample. The color of the outer ribbon represents the group from which it comes. The color of the inner ribbon represents the species, and the length represents the relative richness of the species in the corresponding sample. The large semicircle (right half circle) indicates the distribution proportion of species in the different samples at the taxonomic level. The color of the outer ribbon represents the species, the color of the inner ribbon represents the different groups, and the length represents the distribution proportion of the sample in a certain species.

