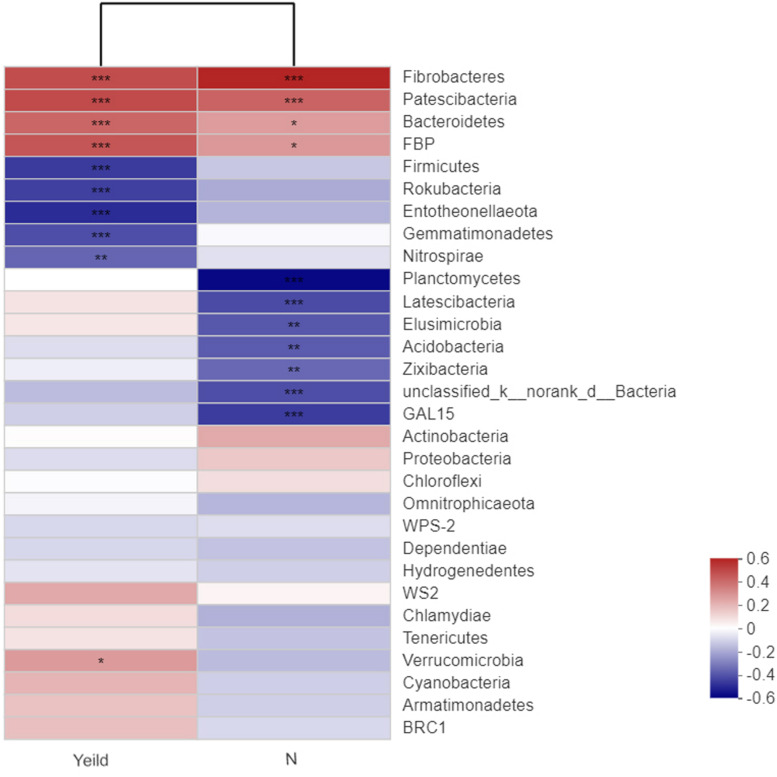
FIGURE 7.
Correlations among the yield, nitrogen application, and dominant soil bacteria. N0-1, N0-5, and N0-10 represent the first, fifth, and 10th year of the 0 kg N hm–2 treatment, respectively. A similar notation has been used for the other fertilizer treatments. The R value is shown in different colors in the figure. If the P-value is < 0.05, it is marked with an asterisk. The legend on the right is the color interval of the different R-values. Cluster trees of the species and environmental factors are presented on the left and upper sides. *0.01 < P ≤ 0.05; **0.001 < P ≤ 0.01; ***P ≤ 0.001.

