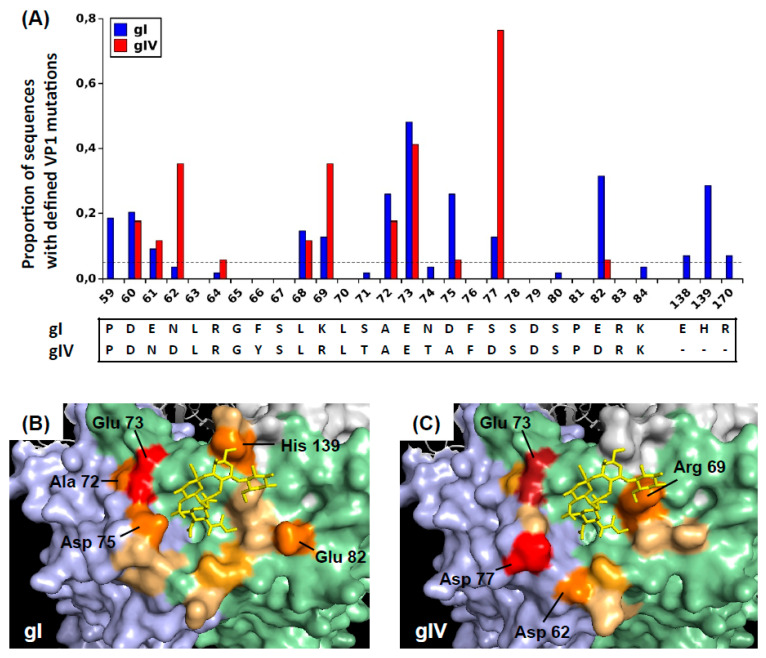
Figure 2.
Distribution of VP1 mutations observed in patients with genotype I and genotype IV virus. (A) Prevalence of VP1 mutations among sequences from 54 patients with genotype I BKPyV (26 typing region sequences AA 55–110, 28 full-length VP1 sequences) and 17 patients with genotype IV virus (typing region sequences only). Localisation of observed mutations on genotype I (B) and genotype IV (C) VP1 pentamers. BKPyV VP1 pentamers (4MJ0 [36]) were visualized with Pymol, and the genotype IV-specific BC-loop residues were added using the mutate function. Adjacent VP1 monomers are coloured light blue, light green and light grey, and the GD3 oligosaccharide is shown in a yellow stick representation. Mutations with prevalence >5% are coloured in progressively darker shades on the following scale: mutation prevalence 5–15% lightorange; 15–25% brightorange; 25–35% orange; 35–45% firebrick; >45% red. The files used to prepare panels (B) gI_VP1Muts_Orange.pse and (C) gIV_VP1Muts_Orange.pse are included in the Supplementary Materials.

