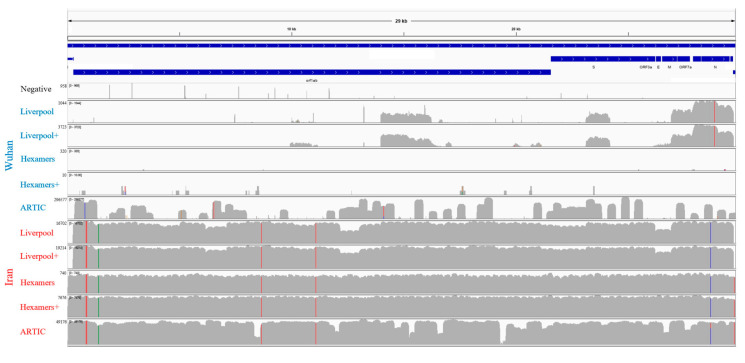
Figure 2.
Mapping and semi-log depth of coverage of trimmed sequencing reads for each library preparation against the first Wuhan SARS-CoV-2 genome sequence (NCBI accession: MN908947•3). Y-axis dimensions vary among samples (maximum indicated beside label) and colored positions reflect frequency of SNPs relative to the MN908947•3 genome among the reads (green = A, blue = C, orange = G, red = T). The plus (+) symbol indicates secondary bait capture enrichment. SARS-CoV-2 genome length and organization is highlighted on top.

