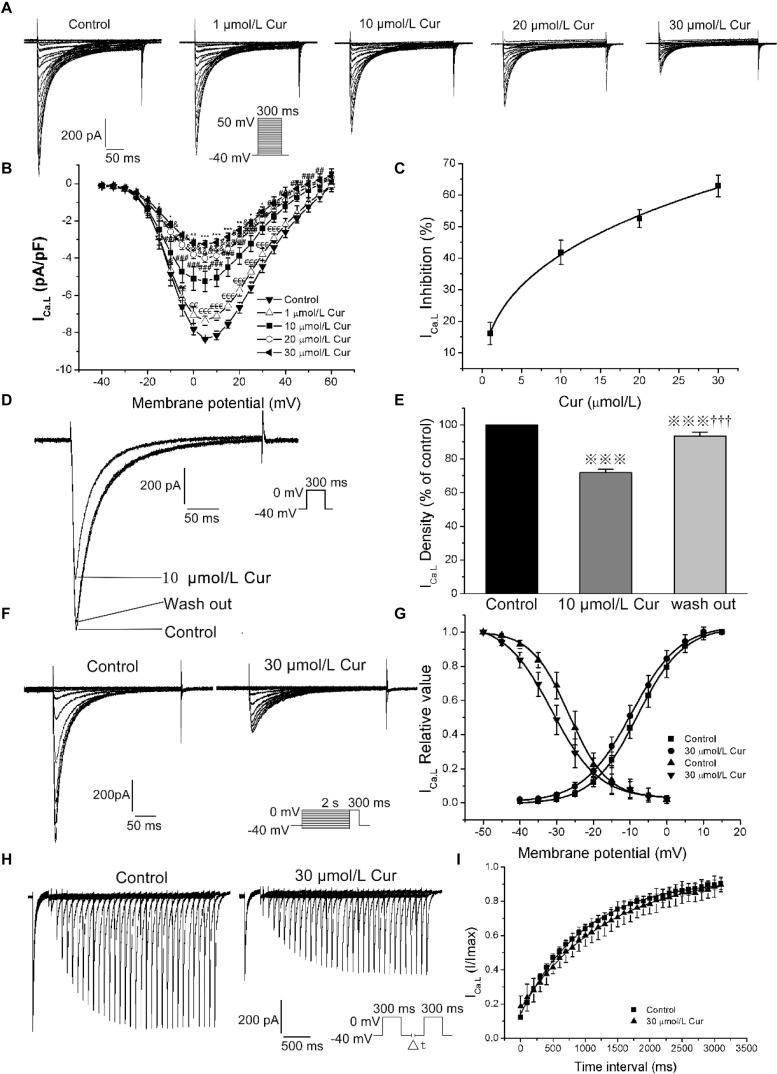
FIGURE 2.
The effects of Cur on L-type calcium current (ICa.L) in ventricular myocytes. (A) Example records ICa.L in different membrane potentials for the control group and Cur (5, 10, 20, and 30 μmol/L) groups. (B) The current–voltage (I–V) relationship curves of Cur on ICa.L (n = 8, €P < 0.05, €€P < 0.01, €€€P < 0.001 vs. control; #P < 0.05, ##P < 0.01, ###P < 0.001 vs. 5 μmol/L; &P < 0.05, &&P < 0.01, &&&P < 0.001 vs. 10 μmol/L; *P < 0.05, **P < 0.01, ***P < 0.001 vs. 20 μmol/L). (C) The concentration–response relationship curve of Cur on ICa.L. (D) Example records of the single ICa.L from the same cell of three groups (control group, 10 μmol/L Cur group and wash out group), showing a reversible inhibitory effect of Cur on ICa.L. (E) The comparison of average ICa.L percentage values of the three groups (n = 6,  P < 0.001 vs. control; †††P < 0.001 vs. 10 μmol/L Cur). (F) Example records of steady-state inactivation of ICa.L before and after administrating 30 μmol/L Cur. (G) Steady-state activation and inactivation curves of two groups. (H) Example records of time-dependent recovery of ICa.L before and after 30 μmol/L Cur administration. (I) Time-dependent recovery curves of the two groups.

