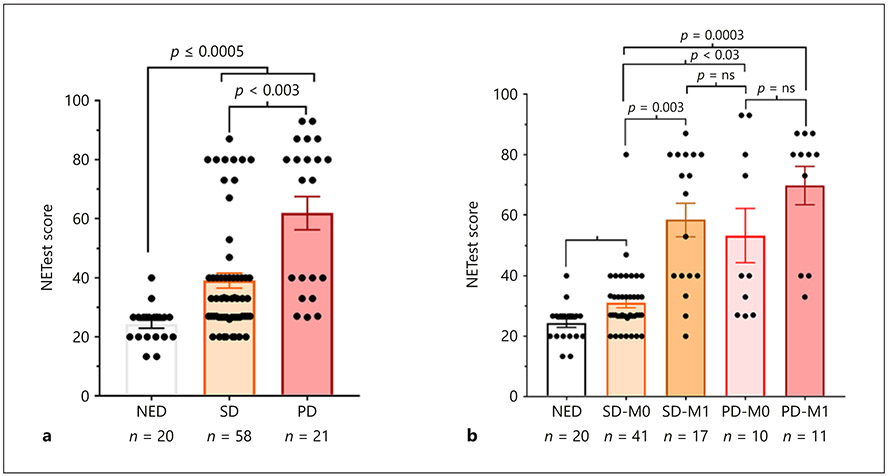
Fig. 3.
NETest in BPC – relationship to clinical status and metastatic disease. a Disease status (RECIST based): measurements of the NETest-identified levels were significantly elevated (p < 0.0005) in stable disease (SD – orange) and progressive disease (PD – red) compared to no evidence of disease (NED) “surgical cures” (white). Levels were significantly elevated (p = 0.0026) in PD compared to SD. b Metastatic disease: NETest levels were significantly elevated in SD with no evidence of distant metastases (SD-M0) compared to NED (p < 0.03). Levels were elevated in SD with distant metastases (SD-M1) versus SD-M0 (p = 0.003). Levels were similarly elevated in PD with (PD-M1) and without metastases (PD-M0). Both PD groups were significantly elevated versus SD-M0 (p = 0.03; p < 0.0003, respectively). Means ± SEM.

