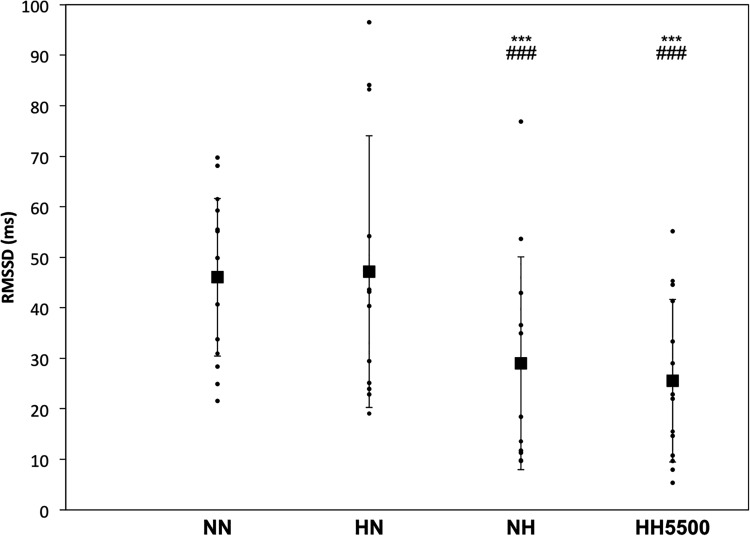
FIGURE 1.
The root mean square of the successive differences (RMSSD) for each subject. Bold squares represent absolute means ± SD for conditions: NN, Normobaric normoxia; HN, hypobaric normoxia; NH, normobaric hypoxia; HH5500, hypobaric hypoxia at 5500 m. ∗∗∗p < 0.001 for difference with NN. ###p < 0.001 for difference with HN.

