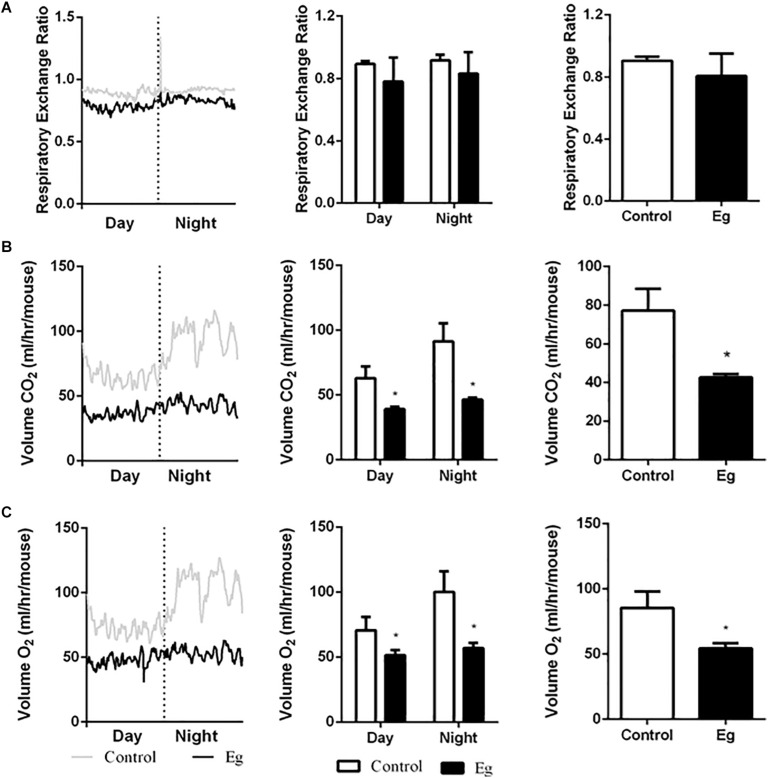
FIGURE 2.
The profile of systemic energy metabolism in EgPSC infected mice. The systemic energy metabolism was determined by the indirect calorimetry. (A) Respiratory exchange ratio (RER). (B) CO2 release (VCO2). (C) O2 consumption (VO2). n = 8 mice for each group. The differences were analyzed using two tailed Student’s t-test. Data represent means with SEM. Asterisks indicate statistically significant differences compared to the control group. *P < 0.05.

