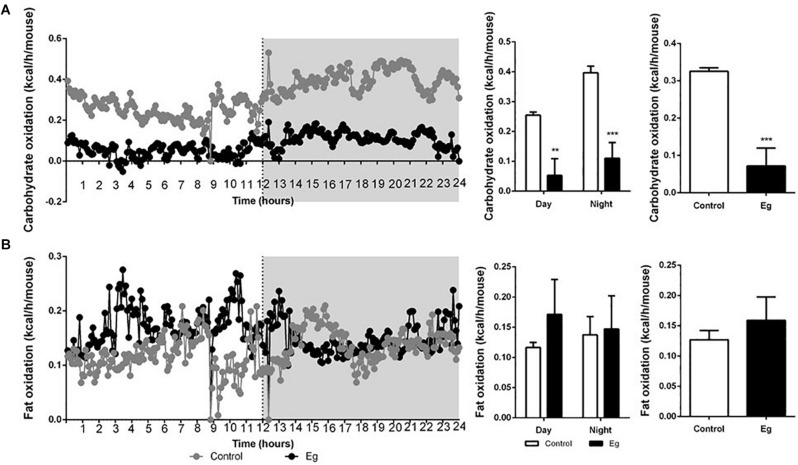
FIGURE 3.
The profile of carbohydrate oxidation and fat oxidation in EgPSC infected mice. (A) Carbohydrate oxidation. (B) Fat oxidation. n = 8 mice for each group. Light and gray areas represent the light and dark phases, respectively. Bar graph analysis means light and dark phase results and all-time results. The differences were analyzed using two tailed Student’s t-test. Data represent means with SEM. Asterisks indicate statistically significant differences compared to the control group. **P < 0.01, ***P < 0.001.

