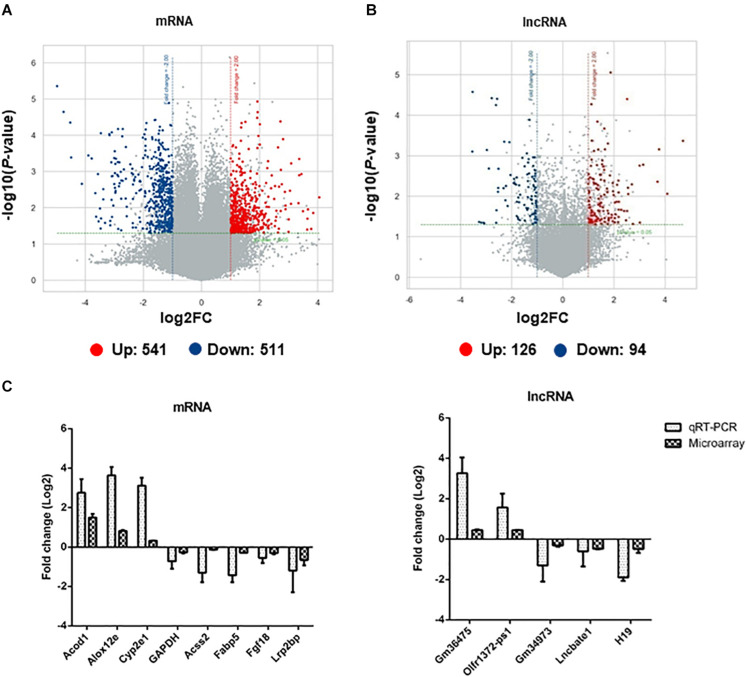
FIGURE 4.
The identification and validation of differentially expressed mRNAs and lncRNAs in adipose tissues of EgPSC infected mice. The volcano plots show the distributions of (A) mRNAs and (B) lncRNAs. The x-axis indicates the fold change. The horizontal green line represents the filter criterion (threshold P ≤ 0.05); red dots, upregulated; blue dots, downregulated. (C) qRT-PCR validation of randomly selected differentially expressed mRNAs and lncRNAs from the microarray data.

