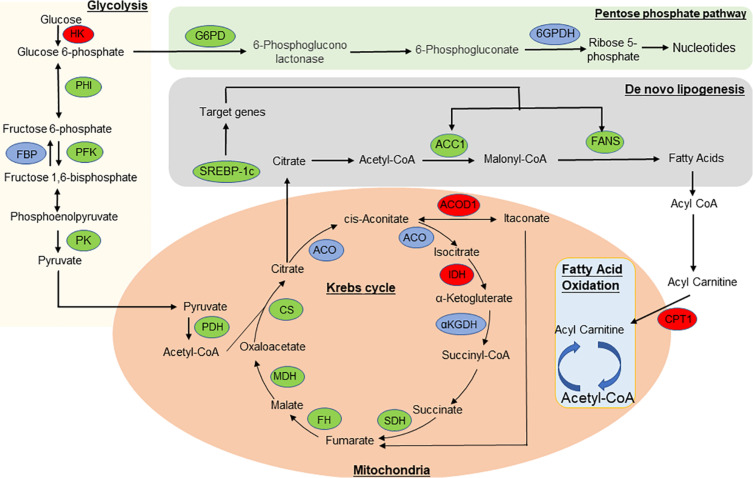
FIGURE 7.
The overview of metabolic reprogramming in adipose tissue in EgPSC infected mice. The metabolism diagram which shows the expression profile of key enzymes. “lipoxygenase” pathways were significantly upregulated while “glycolysis,” “tricarboxylic acid (TCA) cycle,” “pentose phosphate pathway,” and “de novo lipogenesis” pathways were dramatically downregulated. Enzymes identified in our study are marked in red oval (upregulated) and green oval (downregulated), while other enzymes are marked in blue oval. HK, hexokinase; PFK, phosphofructokinase; FBP, fructose bisphosphatase; PHI, phosphate isomerase; PK, pyruvate kinase; PDH, pyruvate dehydrogenase complex; G6PD, glucose-6-phosphate dehydrogenase; 6GPDH, 6-phosphogluconate dehydrogenase; CS, citrate synthase; CPT1, carnitine palmitoyltransferase-1; SDH, succinate dehydrogenase; ACO, aconitase; IDH, isocitrate dehydrogenase; αKGDH, α-ketoglutarate dehydrogenase; FH, fumarate hydratase; MDH, malate dehydrogenase; ACOD1, aconitate decarboxylase 1; ACC1, acetyl coenzyme A carboxylase-1; FAS, fatty acid synthase; SREBP-1c, sterol regulatory element-binding protein-1c.

