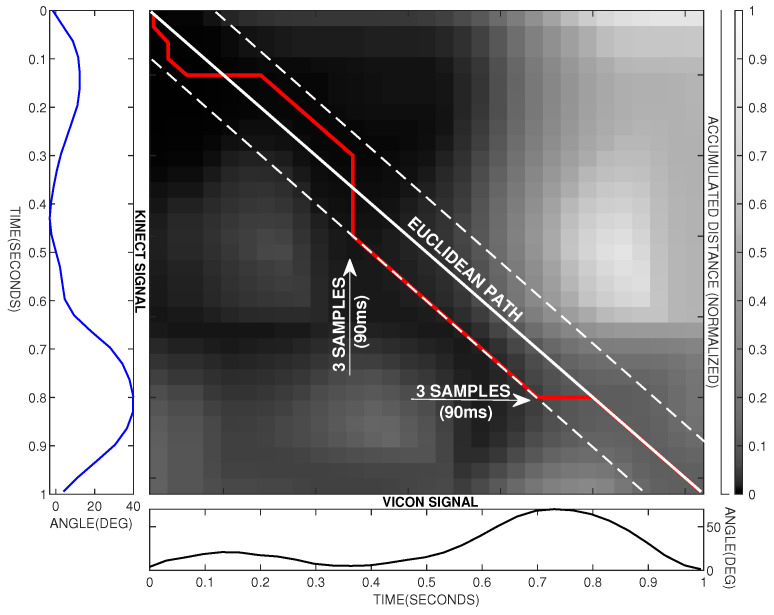
Figure 4.
An example of how the DTW algorithm operates to find similarities between both signals. The movement belongs to the knee flexion/extension. The accumulated distance matrix obtained is shown in gray scale. The Vicon signal is shown as a black line and the Kinect signal as a blue line. The dotted white lines represent the limits of the Sakoe–Chiba band for a warping constraint . The continuous white line represents the Euclidean path. The red line represents the warping path.

