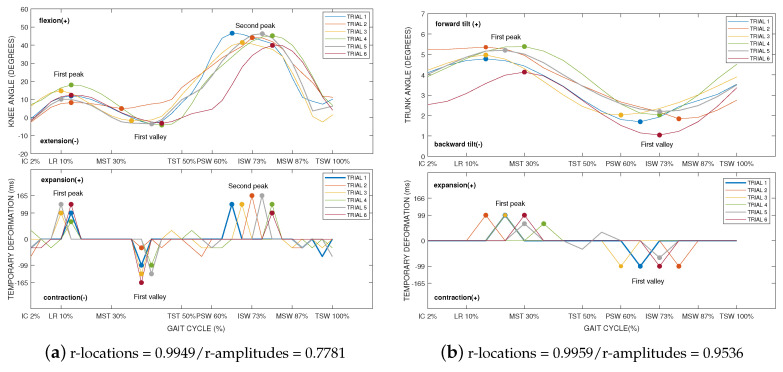
Figure 7.
Examples of the kinematic joint angles and the corresponding temporary deformations represented only on the Kinect signal. The first Pearson correlation was calculated between the locations (r-location) of peaks and valleys of the signal and the locations of the corresponding temporary deformations. A second Pearson correlation was calculated between the amplitudes (r-amplitudes) of peaks and valleys of the signal and the amplitudes of the corresponding temporary deformations. To achieve a better understanding of the areas where temporary deformations occur, the phases of the gait cycle have been identified: initial contact (IC—2%), loading response (LR—10%), mid stance (MSt—30%), terminal stance (TSt—50%), pre-swing (PSw—60%), initial swing (ISw—73%), mid swing (MSw—87%), and terminal swing (TSw—100%).

