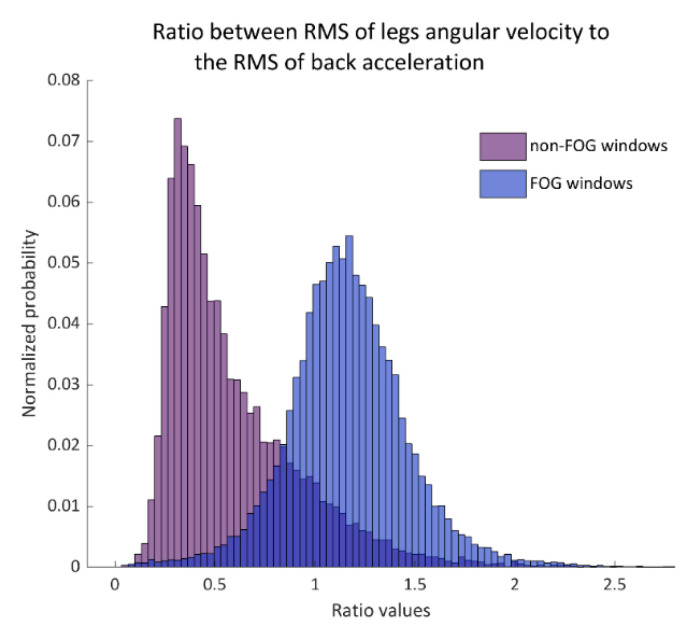
Figure 2.
The histogram of the ratio between legs gyroscope root-mean-square (RMS) to the back-acceleration RMS in non-FOG windows (left histogram) and FOG windows (right histogram). This ratio was used as a primary input feature to the support vector machines (SVM) model. Probability is shown in normalized values.

