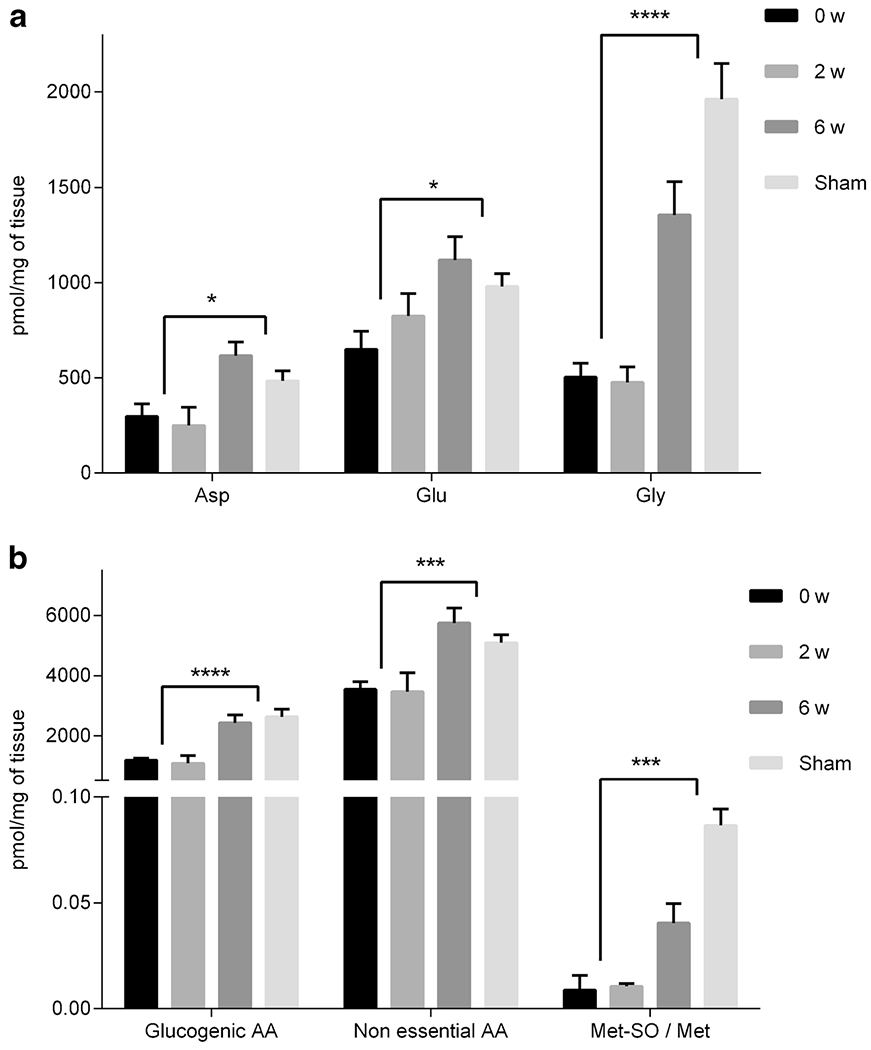
Fig. 3.

Concentrations of selected amino acids (a) and amino acid combinations (b) for lung tissue from 0 w, 2 w, 6 w, and sham groups. Concentrations are in pmol/mg of tissue and presented as mean ± standard error of mean (sem). Significance (t-test with FDR < 5%) was calculated by grouping 2 w and 0 w together and comparing those values to the grouping of 6 w and sham. * p < 0.05, ** p < 0.01, *** p < 0.005, **** p < 0.0001.
