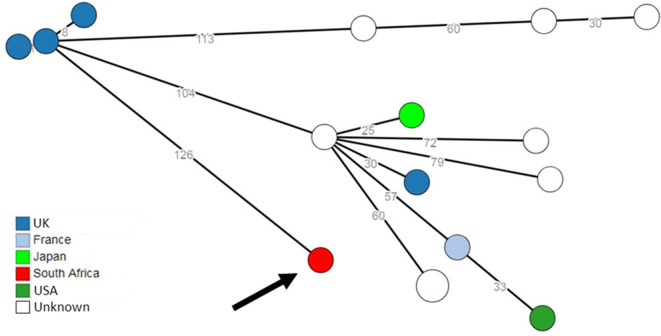
Fig. 2.
Minimum spanning tree drawn using cgMLST data from STEC isolates in the global EnteroBase database. Circular nodes represent isolate(s) having a unique cgMLST profile. The number values between adjacent nodes indicate the number of allele differences between nodes. Colouring of the nodes represents the country source of the isolates. The current STEC O26:H11 isolate is shown with an arrow.

