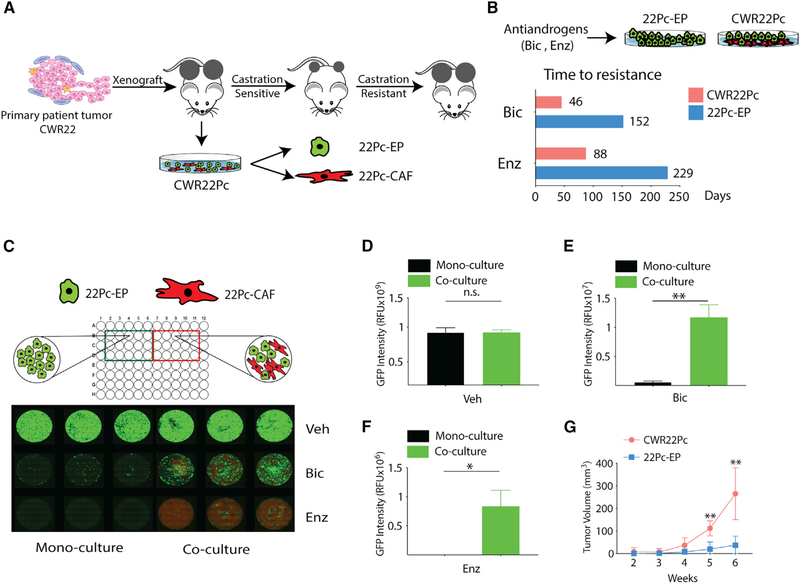
Figure 1. Cancer-Associated Fibroblasts Promote Antiandrogen Resistance in an Androgen-Dependent PCa Model.
(A) Schematic diagram depicting the origin and characteristics of the CWR22Pc model (Dagvadorj et al., 2008). CWR22Pc contains both murine cancer-associated fibroblasts (22Pc-CAF) and human cancer cells (22Pc-EP), as described previously (Mu et al., 2017).
(B) Bar graph showing time to development of resistance to Bic (10 μM) or Enz (1 μM) in CWR22Pc and 22Pc-EP.
(C) Top: cartoon showing 22Pc-EPeGFP + 22Pc-CAFtdTomato co-culture or 22Pc-EPeGFP mono-culture. Bottom: fluorescent images of co-culture assay showing number of 22Pc-EPeGFP cells (green) and 22Pc-CAFtdTomato cells (red) in the presence of Bic (10 μM), Enz (1 μM), or vehicle (Veh, DMSO) on day 30 (n = 3).
(D–F) Quantification of eGFP fluorescence signal intensity from (C) using relative fluorescence units (RFU) in three experimental conditions: Veh (D), Bic (E), or Enz (F) (**p < 0.01, *p < 0.05; n.s., not significant. Student’s t test).
(G) Growth of CWR22Pc or 22Pc-EP tumor xenografts in castrated mice (n = 5 mice per group, **p < 0.01, multiple t test).
Data are represented as mean ± SD (D–F), or mean ± SEM (G). See also Figure S1.

