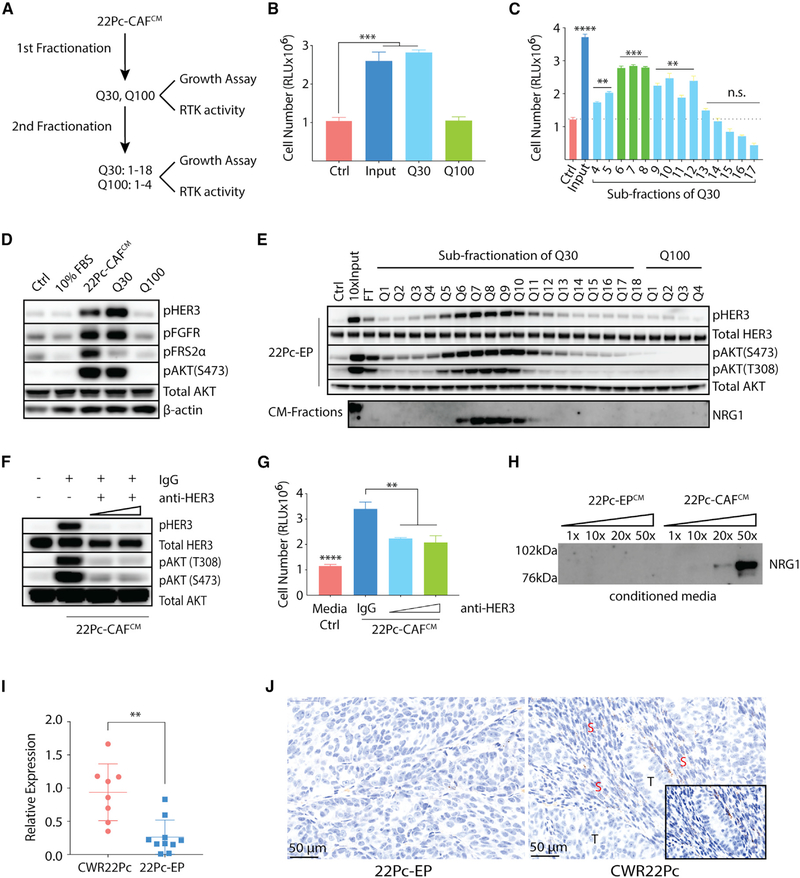
Figure 3. Biochemical Fractionation of CAF-Secreted Resistance Activity Implicates NRG1.
(A) Schematic diagram showing fraction purification and resistance activity in 22Pc-CAFCM.
(B) Growth of 22Pc-EP cells in CSS media supplemented with purified fractions from input (22Pc-CAFCM), Q30, or Q100. CellTiter-Glo reading on day 4. Ctrl, PBS.
(C) Growth of 22Pc-EP cells in CSS media supplemented with sub-purified fractions (Q3–Q17) from Q30. CellTiter-Glo reading on day 4. Input, Q30; Ctrl, PBS.
(D) Western blot analysis of HER3 and FGFR activation in 22Pc-EP after stimulation with FBS media, 22Pc-CAFCM, Q30 or Q100. Ctrl, PBS. β-Actin serves as loading control.
(E) Western blot analysis of HER3-AKT activation in 22Pc-EP after stimulation with different Q fractions and analysis of secreted NRG1 in corresponding fractions. Ctrl, PBS; Input, Q30; FT, flow through. Total AKT serves as loading control.
(F) Western blot analysis of HER3-AKT activation in 22Pc-EP after stimulation with 22Pc-CAFCM in the presence of a commercial HER3-blocking antibody (10 or 30 μg/mL) or immunoglobulin G (IgG) (30 μg/mL). Total AKT serves as loading control.
(G) Growth of 22Pc-EP cells in CSS media supplemented with 22Pc-CAFCM treated with a commercial HER3-blocking antibody (10 or 30 μg/mL) or IgG (30 μg/mL). CellTiter-Glo reading on day 4. Media Ctrl, serum-free media.
(H) Western blot analysis of NRG1 from 22Pc-EPCM or 22Pc-CAFCM (concentrated 1×, 10×, 20×, or 50×).
(I) qRT-PCR analysis of Nrg1 expression in CWR22Pc (n = 8) or 22Pc-EP (n = 10) tumor xenografts using mouse-specific primers.
(J) Representative images showing RNA in situ hybridization (ISH) analysis of mouse Nrg1 expression in CWR22Pc or 22Pc-EP tumor xenografts. T, tumor; S, stroma; mouse-specific Nrg1 probe, brown dots.
Assays were performed with three biological replicates. ****p < 0.0001, ***p < 0.001, **p < 0.01, *p < 0.05; n.s., not significant. (B and C) One-way ANOVA compared with Ctrl group, (G and I) Student’s t test. Data are represented as mean ± SD. See also Figure S3.

