Figure 2.
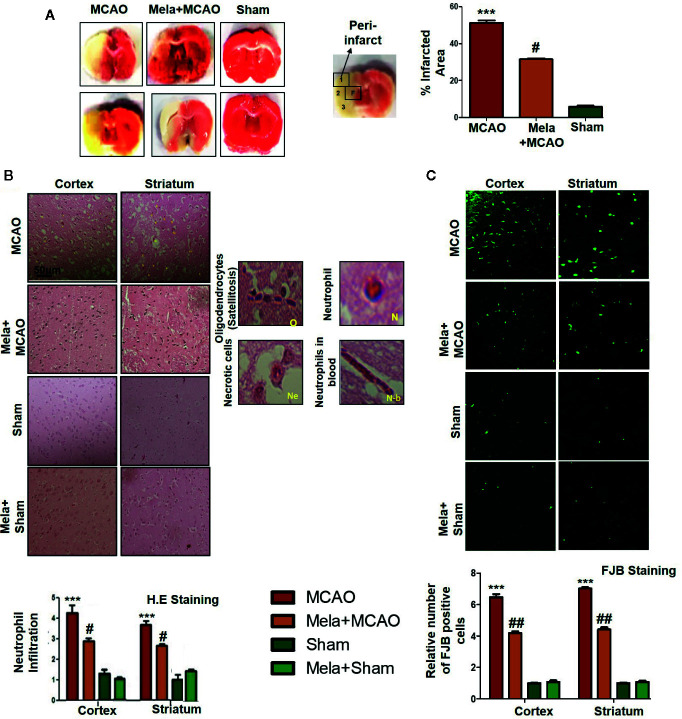
(A) TTC staining was done to demarcate between ischemic and non-ischemic areas and to evaluate the neuroprotective effects of melatonin (n=5/group). The regions of interest (ROIs) selected were indicated by 1 and 4, respectively showing the frontal cortex and striatum. The parietal cortex is shown by 2, and the piriform cortex by 3. TTC staining was analyzed by one ANOVA followed by a non-parametric test (as Kruskal-Wallis test). Significance ∗∗∗p < 0.001 showing significant difference relative to vehicle operated sham group, and #p < 0.05 showing significant difference relative to MCAO group (B) Representative images of H&E staining showing the degree of neutrophil infiltration in cortical and striatal tissue after ischemic insult, scale bar = 50 μm, magnification 40× and (n = 5/group). These tissue slides were processed from the stained TTC coronal sections after fixation in 4% paraformaldehyde. Infiltrated oligodendrocytes (O), neutrophils (N), and neutrophils in blood (N.b) are shown. Necrotic cells (Ne) with scalloped appearance are shown. Data were analyzed by two ways ANOVA followed by post-hoc Bonferroni Multiple Comparison test using graph-pad prism-5 software (C) Representative images of FJB staining, scale bar = 30 μm. These tissue slides were processed from the stained TTC coronal sections after fixation in 4% paraformaldehyde, and the analyzed area is frontal cortex and striatum.). Symbol ∗∗∗ showing significant difference relative to vehicle operated sham group and the value is p < 0.001 or p < 0.01, respectively, while # or ## showing significant difference values of p < 0.05 or p < 0.01, respectively, relative to MCAO group. TTC, 2,3,5-Triphenyltetrazolium chloride; FJB, Fluoro-Jade B; H&E, hemotoxylin and eosin.

