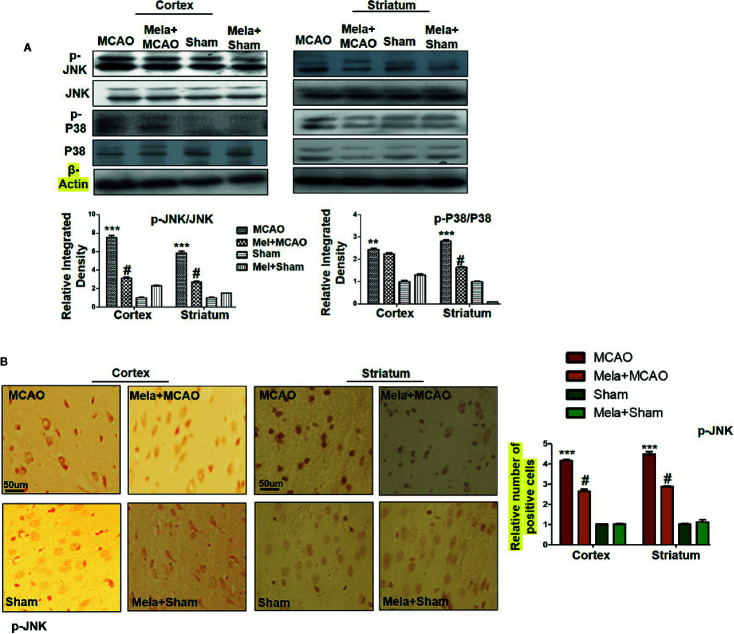
Figure 3.
(A) The immunoblot results of p-P38, total P-38, p-JNK, and total JNK from the ipsilateral cortex and striatum following MCAO. The immunoblot bands were quantified using ImageJ software, and the statistical differences are indicated in the corresponding graphs. The data are expressed as the mean ± SEM for n = 6 rats/group, and the number of experiments = 3. β-Actin was used as a control. Data were analyzed by two-way ANOVA followed by post-hoc Bonferroni Multiple Comparison test using graph-pad prism-5 software. The brain tissue for Western blot was collected after 24 h of vehicle or melatonin treatment and stored at −80°C until used. Symbol ∗∗∗ or ∗∗ showing significant difference relative to vehicle operated sham group and their values are p < 0.001 or p < 0.01 respectively, while # showing significant difference values of p < 0.05 relative to MCAO group. (B) The presented images indicated Immunoreactivity of p-JNK in the cortical and striatum tissue of rat brain. The p-JNK exhibits cytoplasmic localization. The data are expressed as the mean ± SEM for n = 5 rats/group, and the number of experiments = 3. Scale bar = 50 μm, magnification 40×. The immunohistochemistry slides were processed from the stained TTC coronal sections after fixation in 4% paraformaldehyde. From the thick coronal TTC sections, paraffin blocks were made, and later 4-μm-thin coronal sections were prepared by a rotary microtome. The symbol ∗∗∗ showing significant difference relative to the vehicle operated sham group and the value is p < 0.00, while # showing significant difference value of p<0.05 relative to the MCAO group. p-JNK, phospho c-Jun N-terminal kinase; JNK, c-Jun N-terminal kinase; p-P38, phospho-P38.

