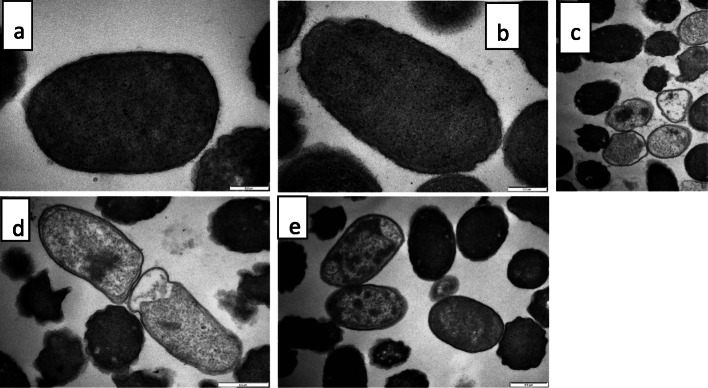
Fig. 3.
Transmission electron microscopic morphology of E. coli cells: a = untreated control after 24 h (cell have uniform cytoplasmic density and intact cell membranes), b = acetone solvent control after 24 h (cells have uniform cytoplasmic density, intact cell membrane), c = gentamicin-treated cells after 24 h (some cells are electron sparse, and detached from the cell wall), d = after 3-h exposure to 0.04 mg/mL extract of Syzygium legatii (cell membrane detaching from cell, translucent cytoplasm, shrunken, misshapen cells), e = after 3-h exposure to 0.04 mg/mL extract of Eugenia zeyheri (cell membrane detaching from cell, with islands of condensed chromatin)

