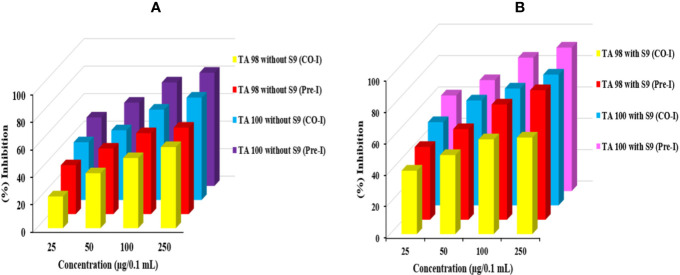
Figure 3.
Graph represents the antimutagenic potential of Obeth using S. typhimurium in Ames assay. (A) Represents the TA100 and TA98 without S9 (Pre and Co-incubation). (B) Represents TA100 and TA98 with S9 (Pre and Co-incubation). (A) Represent the percent inhibition between co- and pre-incubation in TA98 and TA100 strain without S9. (B) Represent the percent inhibition between co- and pre-incubation in TA98 and TA100 strain with S9.

