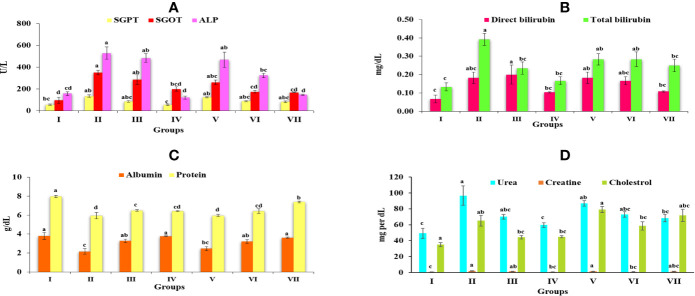
Figure 4.
Graph represents the effect of Obeth of O. bracteata on level of serum enzymes level in CCl4-treated male Wistar rats. (A) Represent the levels of SGOT, SGPT, and ALP. (B) Represent the levels of direct bilirubin and total bilirubin. (C) Represent the levels of albumin and total protein. (D) Represent the levels of urea, creatine and cholesterol. Values are expressed as Mean ± SE at level of significance p ≤ 0.05. Data labels with different letters represent significant difference among them.

