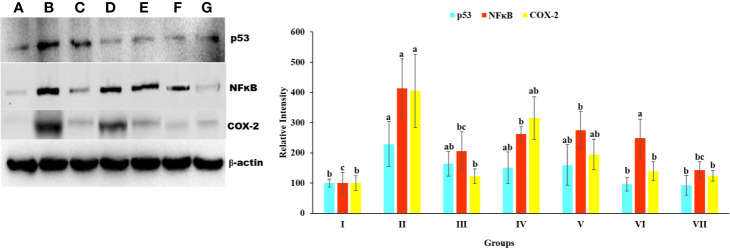
Figure 9.
Expression level p53, NFκB, and COX-2 protein in liver homogenate of Wistar rats detected using Western blotting. (A) Control group (tap water ad libitum) (GI), (B) CCl4: Olive oil (1:1; 1mL kg-1b.wt.) induced elevation in the expression level of p53 was noted. (C) Silymarin (100 mg kg-1b.wt.) + CCl4, (D) low dose (50 mg kg-1b.wt.) + CCl4, (E) medium dose (100 mg kg-1b.wt.) + CCl4, (F) High dose (200 mg kg-1b.wt.) + CCl4, (G) Negative (only extract 100 mg kg-1 b/wt.). Histograms showing densitometric analysis of p53, NFκB, and COX-2 protein bands using western blotting. Band density was measured and normalized to that of β-actin. Values are expressed as mean ± SE at level of significance p ≤ 0.05. Data labels with different letters represent significant difference among them.

