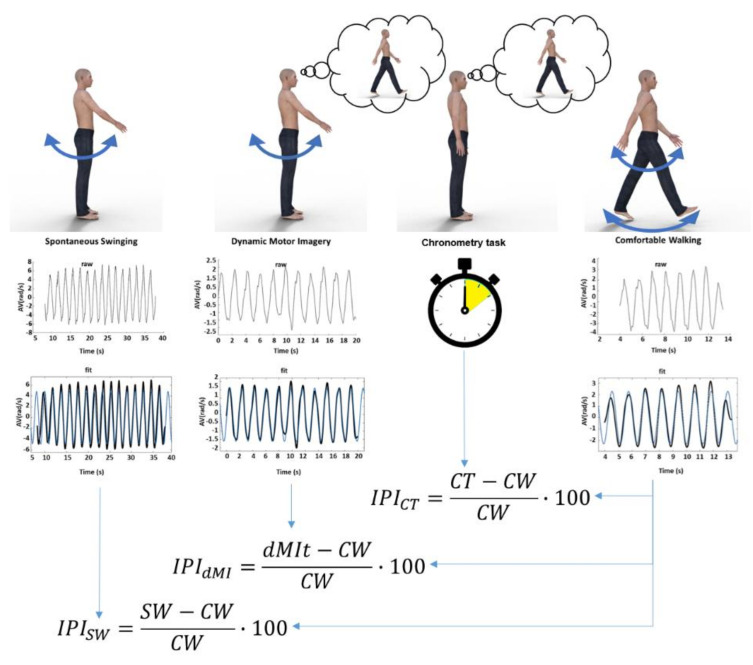
Figure 1.
Schematic representation of the study. At the top of the figure, the four experimental conditions are represented: limb swinging (SW), limb swinging during dynamic motor imagery (dMI), chronometry task of imagined walking without any movement (CT) and comfortable walking (CW). In the middle: plots showing a raw signal of the angular velocity recorded, plots showing filtered signals (black lines) and sinusoidal fits (blue lines) for SW, dynamic motor imagery task (dMIt), CW, whereas just time was measured with a stopwatch in CT. Below, the formulas of the Incongruency Performance Index for the first three experimental conditions compared to the actual walking performance of the fourth condition.

