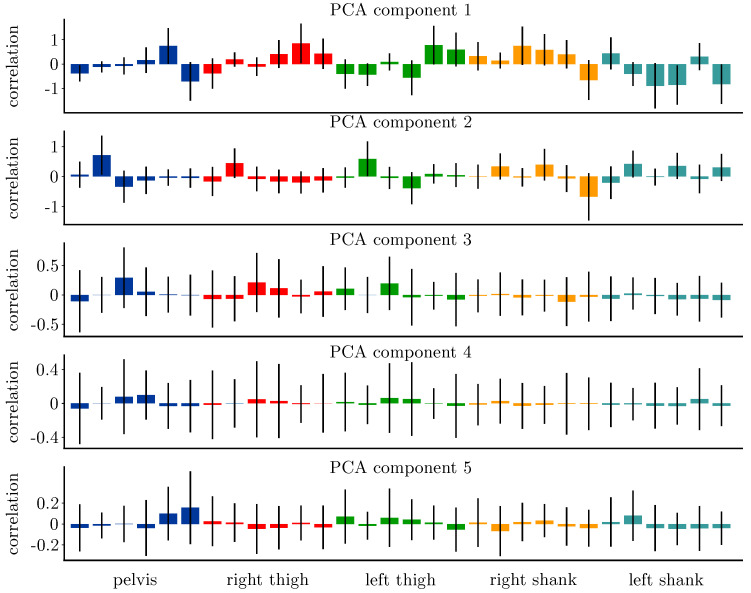
Figure 5.
Correlation of each sensor’s reading (, , , , , ) with the first five PCA components. The correlation strength of the acceleration is, in general, less than that the correlation of the angular rate with the single components. The pelvis and shank sensors show stronger correlations with the PCA components than the thigh sensors.

