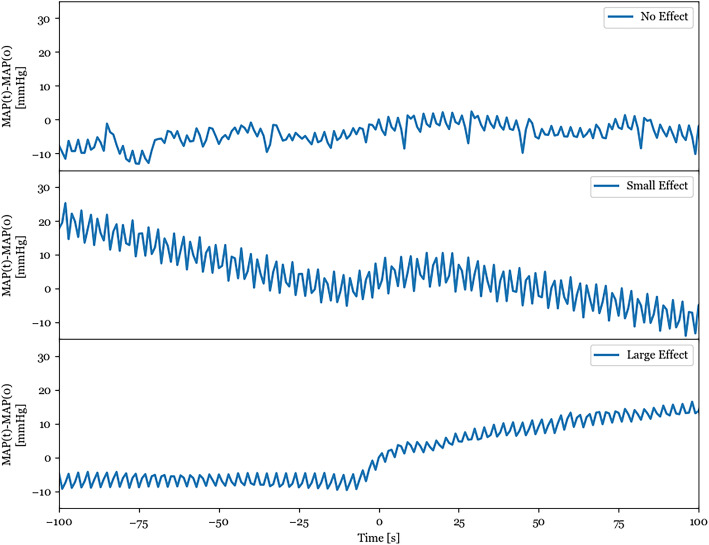
Fig. 3.
There are a variety of individual responses to a calcium bolus. The top subplot shows a calcium injection that has no observable effect on the mean arterial pressure. The middle subplot shows a calcium injection that has a modest effect on the mean arterial pressure, but the MAP resumes its decline after about 20 s of improvement. The bottom subplot shows a calcium injection that has a large effect on arterial pressure where the MAP improves due to the calcium bolus and then continues to improve and stabilize as a function of time. These tracings were chosen to represent the spectrum of observed responses

