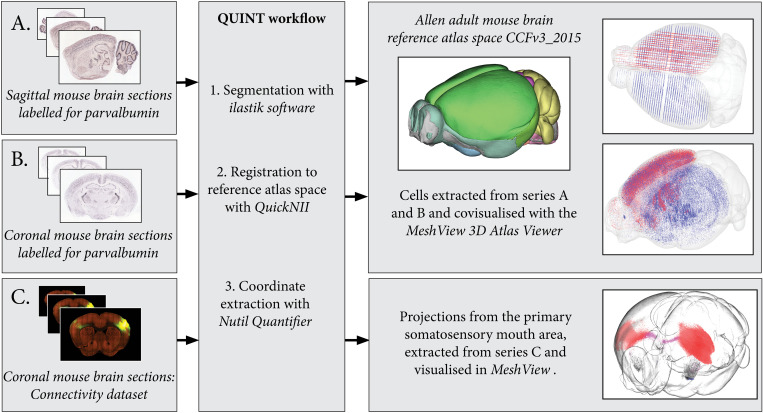
FIGURE 4.
By processing several image series with the QUINT workflow, point clouds representing labeled features can be covisualized in reference atlas space allowing comparisons of expression patterns. Here, parvalbumin positive cells are extracted from two mouse brain section series: one cut in the sagittal plane (A) and the other in the coronal plane (B). The cells are covisualized in Allen Adult Mouse Brain Reference atlas space with the MeshView atlas viewer. Likewise, the connectivity use case (C) displays projections from the primary somatosensory mouth area, labeling in all brain areas is quantified and visualized in 3D with differential color coding dependent on the brain region (neocortex, red; corpus callosum, pink; striatum, black). Image Credit for 2D section images: Allen Institute. Series: http://mouse.brain-map.org/experiment/show/75457579, http://mouse.brain-map.org/experiment/show/79556738, https://connectivity.brain-map.org/projection/experiment/112936582.

