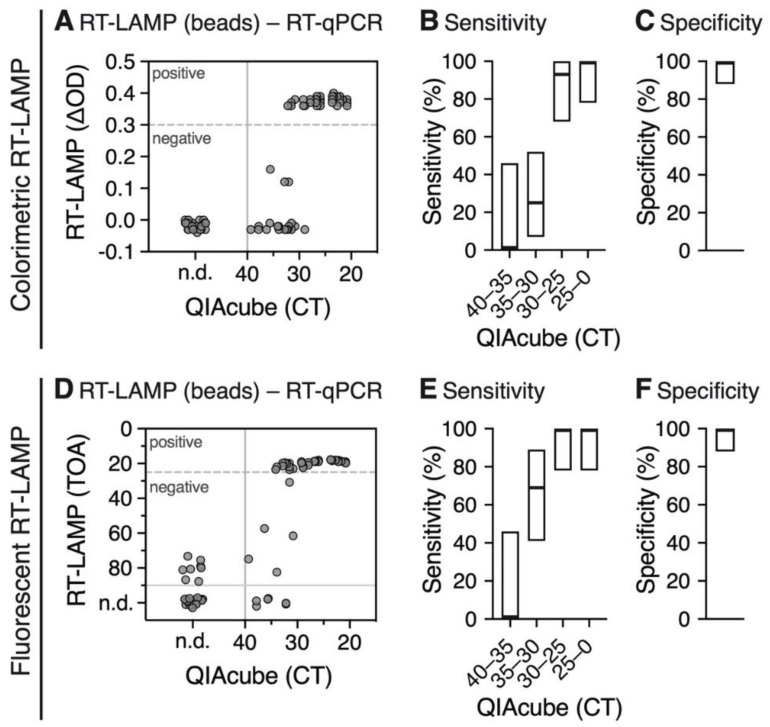
Figure 5.
Analysis of colorimetric (A–C) and fluorescent (D–F) RT-LAMP of RNA extracted using the magnetic bead RNA extraction protocol compared to RT-qPCR CT values obtained from RNA isolated by the QIAcube extraction. (A) Scatter plot shows optical density differences obtained from colorimetric RT-LAMP (ΔOD = OD434nm−OD560nm) at a time point of 30 min. The ΔOD threshold of 0.3 is indicated as a dashed line. All samples with a CT > 40 were considered as negative (solid line); n.d., not determined. (B,C) Sensitivity (B) and specificity (C) of colorimetric RT-LAMP for different CT ranges. The boxes indicate the 95% Clopper-Pearson confidence interval (Supplementary Table S2). (D) Scatter plot shows time of amplification (TOA) in min for each sample obtained from fluorescent RT-LAMP compared to RT-qPCR CT values obtained from RNA isolated by the QIAcube extraction. The TOA threshold of 25 min (dashed line) was used to define positive and negative samples from RT-LAMP. All samples with a CT > 40 and TOA > 25 min were considered as true negative (solid lines). (E,F) Sensitivity (E) and specificity (F) of fluorescent RT-LAMP for different CT ranges. The boxes indicate the 95% Clopper-Pearson confidence interval (Supplementary Table S3).

