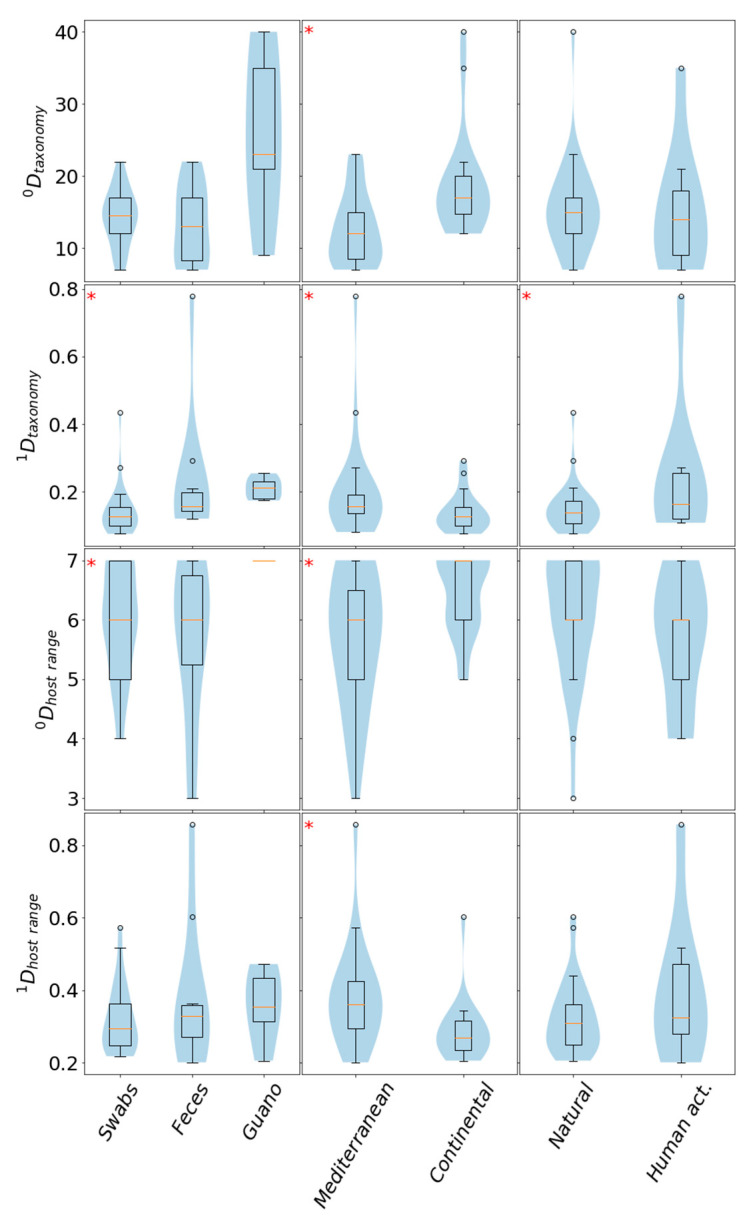
Figure 3.
Taxonomy and host-range-based Hill diversity indices (D) calculated by grouping samples according to sample type (oral swab, feces, guano), geographical locations from where the samples were obtained (Mediterranean, continental) and whether the surrounding landscape is subject to human activity (Natural, Human act.). * denotes there may be statistically significant differences (p < 0.01) between the population medians of the strata, based on the Kruskal–Wallis test. The diversity indices are depicted a violin plots, widths of the “violins” correspond to the kernel density estimates at the given ordinate, and as box and whisker plots, indicating the data mean (orange line), the box stretches between the first (Q1) and the third quartile (Q3), and the whiskers enveloping the most extreme values lower than Q1 or higher than Q3 by more than 1.5 * (Q3-Q1); values beyond the whisker definition are depicted as individual circles/points.

