Figure 7.
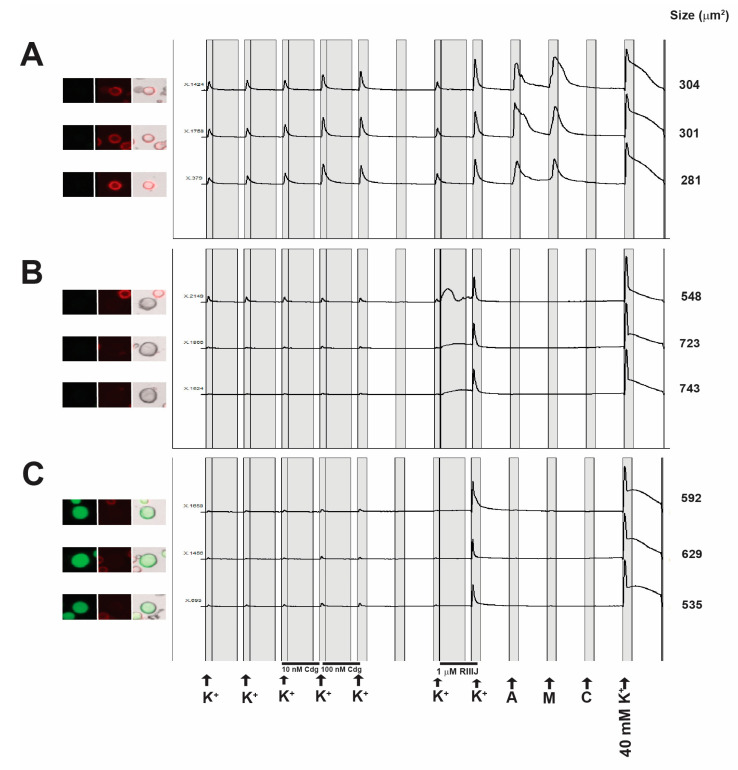
Constellation Pharmacology. The images starting from the left are taken using (1) the green fluorescent (GFP) filter to visualize calcitonin gene related peptide (CGRP), (2) Cy5 filter to visualize cells stained with isolectin B4 (IB4), (3) merged images of the GFP, Cy5 and brightfield channels, and (4) the calcium imaging trace. Each calcium imaging trace corresponds to the response of a single cell to the pharmacological challenge indicated on the X-axis at the bottom of panel C. The Y-axis indicates the ratio of emission at 340/380 nm. The sizes of each cell are indicated on the right of each trace. The pharmacological agents are as follows: allyl isothiocyanate (A), menthol (M) and capsaicin (C). Panel (A) is cell class affected by cdg14a. These cells are small (<500 μm2), with strong IB4 staining, and respond to allyl isothiocyanate, an agonist of the TrpA1 receptor and to menthol, an agonist of TrpM8. The effects of cdg14a at different concentrations are seen as higher peak amplitude in pulses 4 to 5 relative to baseline responses in pulses 1 to 3. The mean response to 10 nM cdg is 76 ± 11%, increase in peak height relative to the control. The K+ concentration in these pulses is 20 mM unless specified. Panels (B,C) are classes of cells that are generally not affected by cdg14a. Cells in (B) are large cells (>500 μm2) that show a direct response to the voltage-gated K+ channel inhibitor conotoxin κM-RIIIJ (RIIIJ), while cells in (C) (>500 μm2) which are CGRP positive, have an indirect response to RIIIJ as shown by a higher response to 20 mM K+ immediately after RIIIJ incubation.

