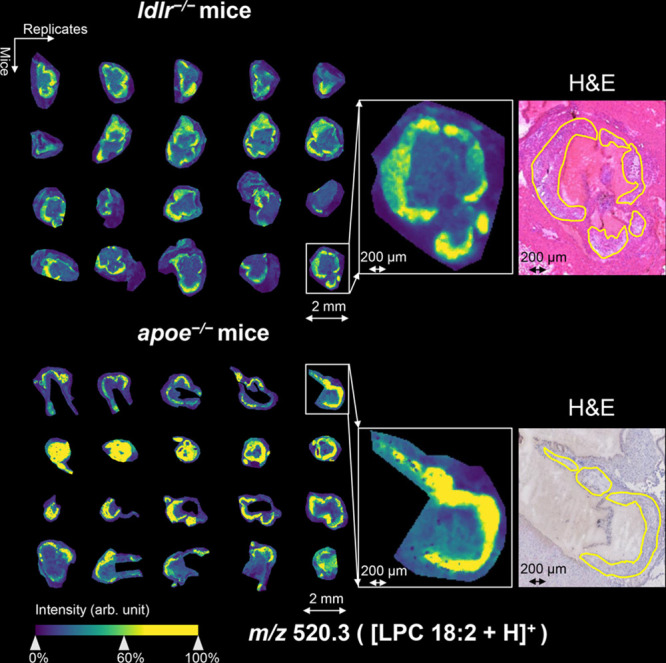
Figure 3.

Visualization of m/z 520.3 (LPC 18:2) in aortic roots of ldlr–/– mice and apoe–/– mice in positive ion mode (with weak denoising). On the left, the location of LPC 18:2 in 40 different tissue sections of four mice from every mouse model is shown as detected by MALDI mass spectrometry imaging. Magnifications of selected tissue sections and their coregistered, hematoxylin and eosin (H&E)-stained images are shown in the right-hand side (plaque circumferences are indicated in yellow).
