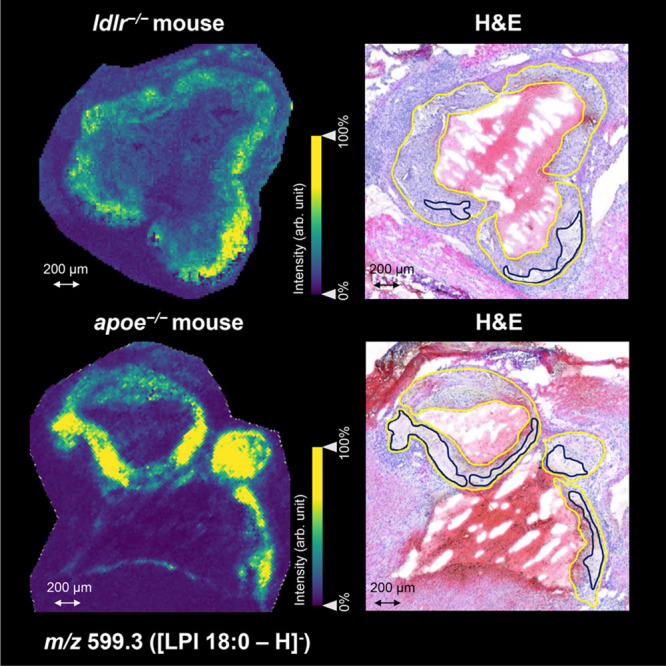
Figure 4.

Visualization of m/z 599.3 (LPI 18:0) in aortic roots of apoe–/– and ldlr–/– mouse in negative ion mode. On the left, the location of LPI 18:0 is shown as detected by MALDI mass spectrometry imaging in both mouse models. On the right, the coregistered hematoxylin and eosin (H&E)-stained images demonstrate that LPI 18:0 is particularly confined to the necrotic core regions within the plaques (plaque and necrotic core circumferences are indicated in yellow and dark blue, respectively).
