Figure 5.

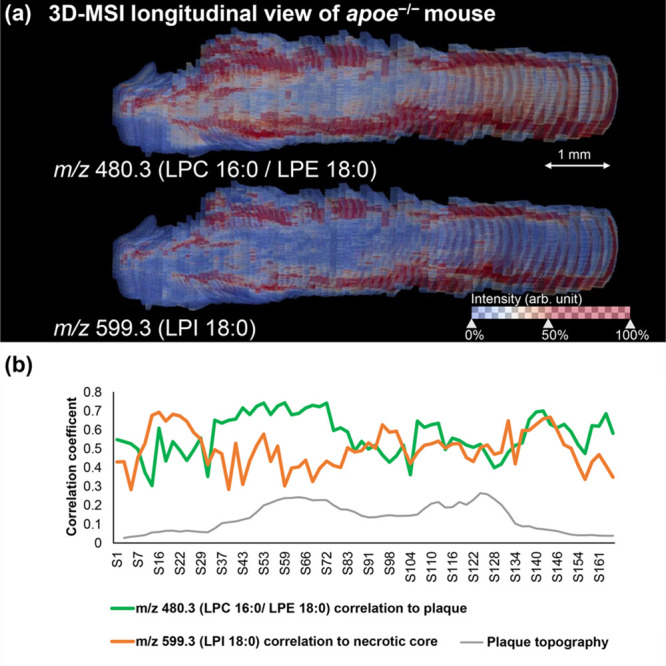
Three-dimensional longitudinal visualization of the plaque-specific lipids m/z 480.3 (LPE 18:0/LPC 16:0) and m/z 599.3 (LPI 18:0) as detected by 3D MALDI mass spectrometry imaging in an aortic root of an apoe–/– mouse (a). Spatial correlation analysis was performed for m/z 480.3 (LPE 18:0/LPC 16:0) on the annotated plaque area and for m/z 599.3 (LPI 18:0) on the annotated necrotic core area, respectively, on a section-by-section basis. This allows showing the variation of the correlation of two lipids to the respective annotations along the z-direction of the plaque (b). The blood flow direction is from left to right.
