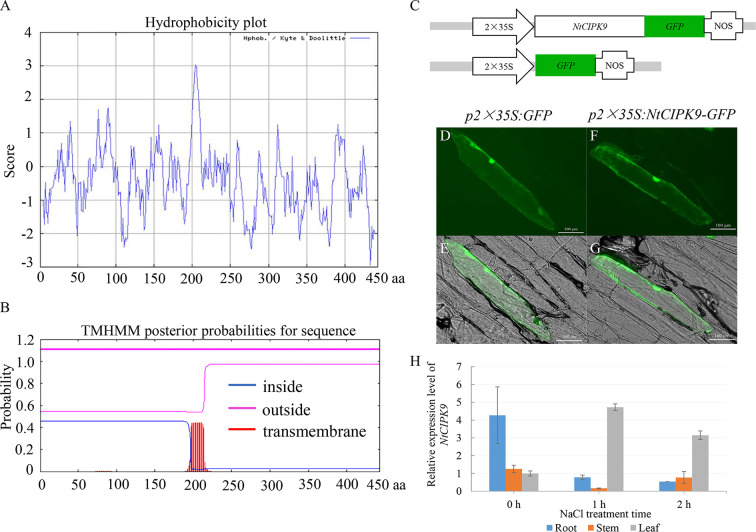
Figure 3.
Structure analysis and subcellular localization of NtCIPK9. (A) Hydrophobicity plot of NtCIPK9. (B) The predicted transmembrane helix domain of NtCIPK9. (C) Schematic of the vectors used for analysis of NtCIPK9 subcellular localization. (D–G) NtCIPK9 subcellular localization. p35S:GFP serves as the control. (H) Relative expression level of NtCIPK9 in different tissues of Nitraria tangutorum. Data represent means ± SD from three biological replicates.

