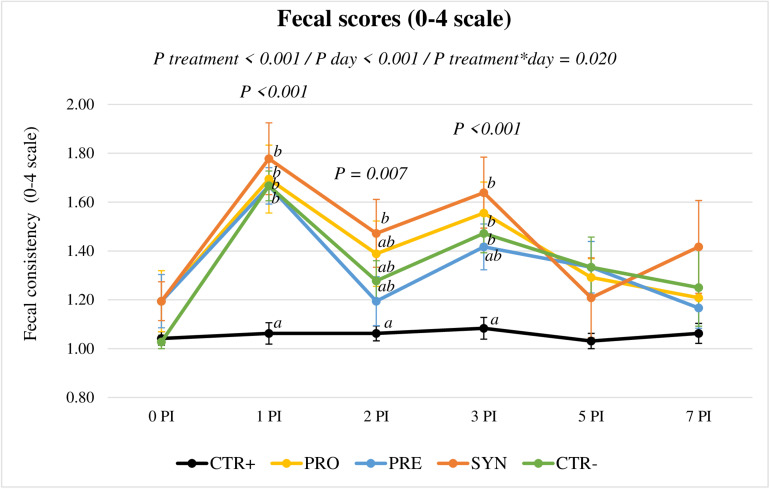
FIGURE 3.
Evolution of average fecal scores for the different experimental groups in the post-inoculation period. CTR+: Non-inoculated animals receiving placebo; PRO: Inoculated animals receiving the probiotic; PRE: Inoculated animals receiving the prebiotic; SYN: Inoculated animals receiving the synbiotic; CTR−: Inoculated animals receiving placebo. N = 6 for all groups except for non-challenged animals, N = 8. Bars correspond to standard error.

