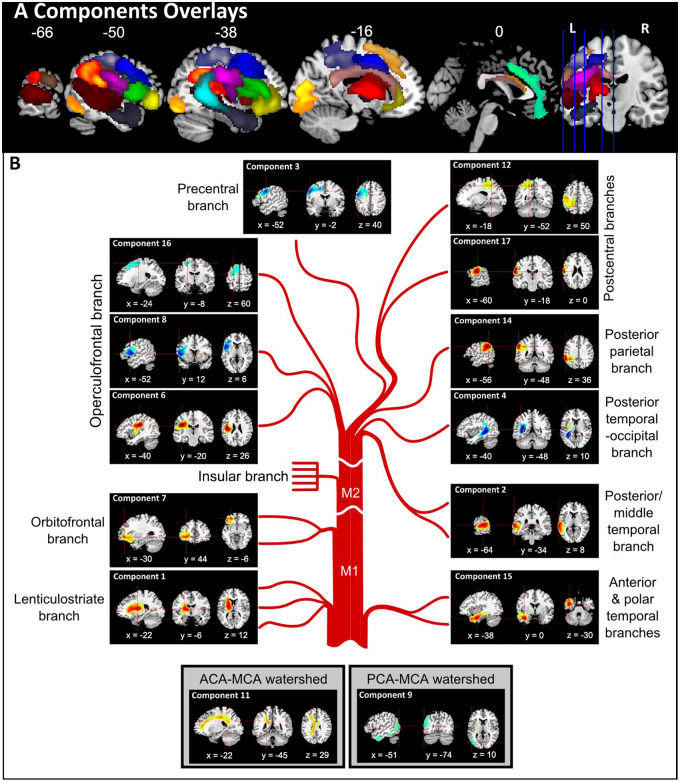
Figure 2.
Principal component analysis of abnormality likelihood maps. (A) Components overlays. Components 1–8 and 11–17 are shown on the same brain template. (B) Individual components of MCA illustrated in detail—note the brief labels refer to visually-matched MCA components but may well also reflect other important vascular individual differences such as alternative branching and variable watershed regions (see main text for descriptions).

