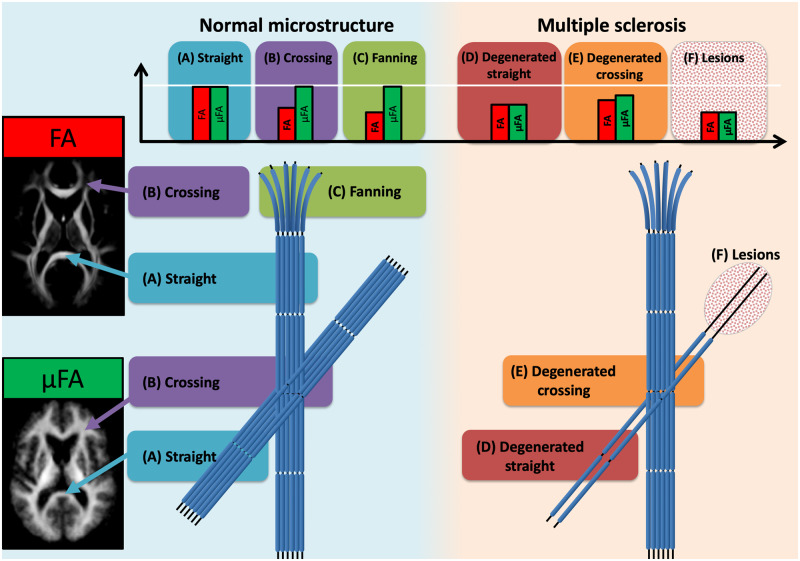
Figure 1.
Schematic drawing. This schematic illustrates the expected effects on FA and μFA in various WM environments in normal tissue and damaged multiple sclerosis tissue. In addition, the figure includes voxel-wise averages of FA and μFA. In straight fibre environments (A) it is expected that both FA and μFA will be high and approximately equal, but crossing (B) and fanning (C) fibre situations will expectedly decrease FA but keep μFA high. In straight degenerated fibre bundles (D) both FA and μFA will be lower as compared with the normal tissue (A). In crossing fibres when one fibre bundle is degenerated (E) FA may be higher and μFA lower as compared with the normal tissue (B). Lesions in straight fibre bundles (F) will decrease both measures equally. FA = fractional anisotropy; μFA = microscopic fractional anisotropy.

