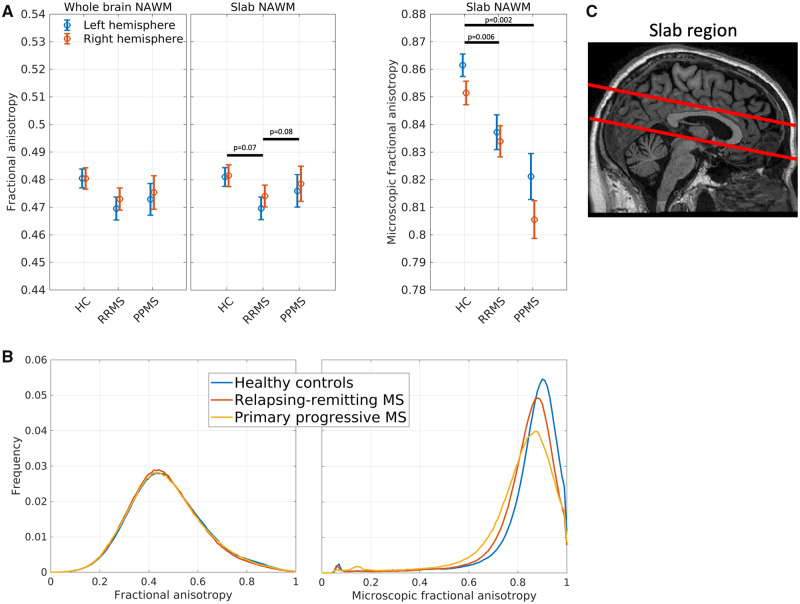
Figure 2.
Group average fractional anisotropy and microscopic anisotropy. (A) Left: group FA averages within the whole-brain NAWM; middle: FA group averages within a slab of NAWM; right: μFA group averages within a slab of NAWM. Error bars indicate standard error of the mean. (B) FA (left panel) and μFA (right panel) histograms of NAWM. The histograms were estimated within each subject and then averaged within groups. (C) Imaging slap where microscopic fractional anisotropy was acquired. RRMS = relapsing-remitting multiple sclerosis; PPMS = primary-progressive multiple sclerosis.

