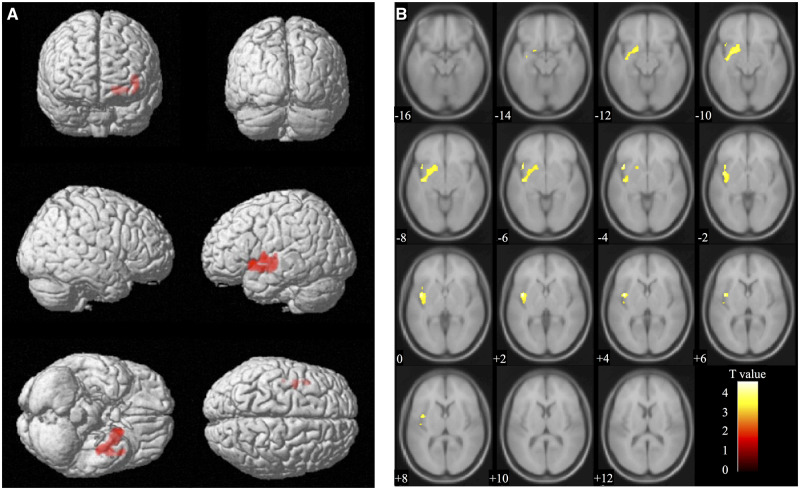
Figure 2.
Voxel-based morphometry findings. Positive correlation between serum oxytocin levels (Time 1) and brain volume (Time 2) shown by multiple regression. The significant cluster (cluster size, 1225 voxels) containing the left hippocampus (coordinates −38, −12, −9) and the left amygdala (coordinates −29, 2, −9) is shown in (A) whole brain images and (B) axial images. T value applies to (B) axial images.

