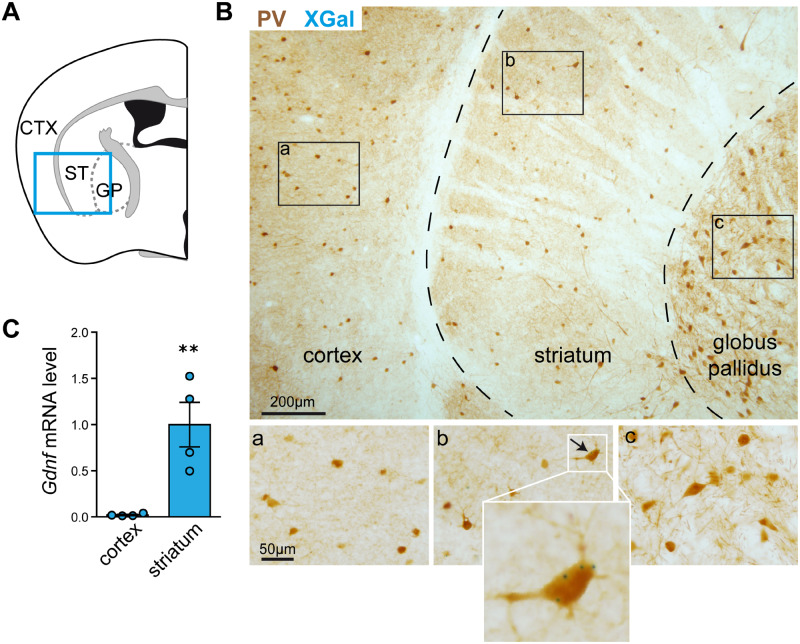
Figure 1.
Selective expression of GDNF in mouse striatal PV interneurons. (A) Schematic illustration of the CTX, ST and globus pallidus in a coronal section of the mouse brain. (B) Immunostaining of PV interneurons (brown) and selective expression of GDNF, reported by positive XGal-positive staining (blue dots), in the ST. (a), (b) and (c) are magnified fields showing details such as XGal blue dots only visible in (b). (C) Comparison of Gdnf mRNA expression (measured by qPCR) in the ST and CTX (N = 4, ** P < 0.01, two-tailed Student’s t-test).

