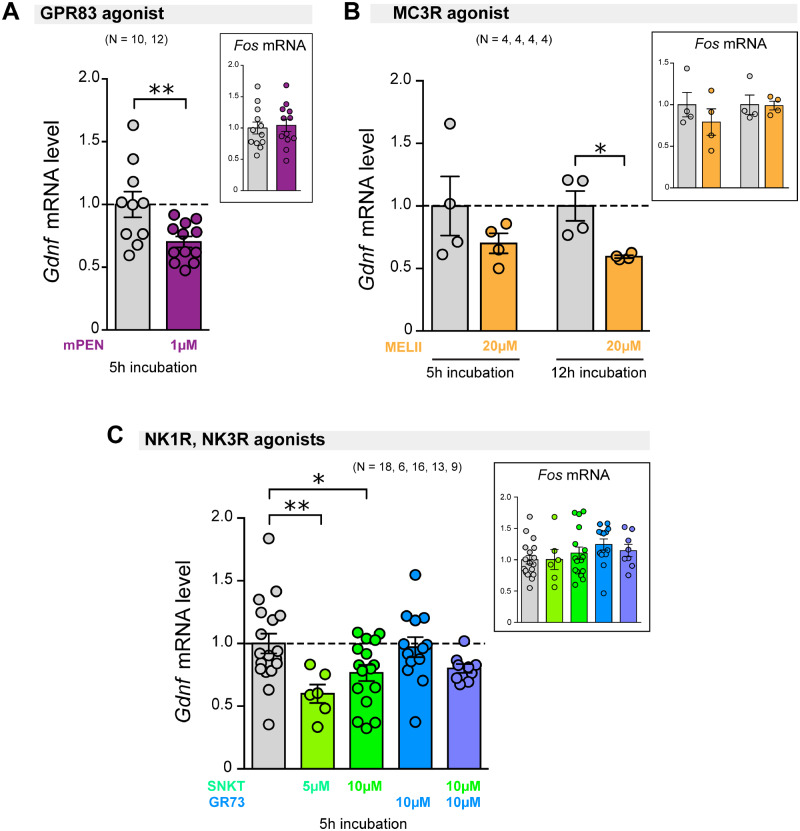
Figure 7.
Effect on Gdnf gene expression of pharmacological modulation of GPCRs expressed in striatal parvalbumin interneurons. Vertical bar graphs indicate Gdnf mRNA level (measured by qPCR with Hmbs gene as internal reference) in the ST from brain slices incubated for 5 or 12 h under ex vivo conditions. The level of Fos mRNA was used as a marker for pan-neuronal activation (measured by qPCR and normalized to Actb mRNA). (A) Stimulation of GPR83 by selective mPEN (1 µM) for 5 h. (B) Stimulation of Melanocortin receptor 3 (MC3R) by Melanotan II (20 µM) for 5 or 12 h. (C) Stimulation of tachykinin receptors 1 and 3 (NK1R, NK3R) for 5 h by their respective specific agonists GR73632 (GR73; 10 µM) and Senktide (10 µM). The number of experimental replicates (N) is indicated above the bar graphs. * P < 0.05, ** P < 0.01, two-tailed Student’s t-test for two sample differences, or one-way ANOVA with Tukey’s multiple comparison test were applied.

