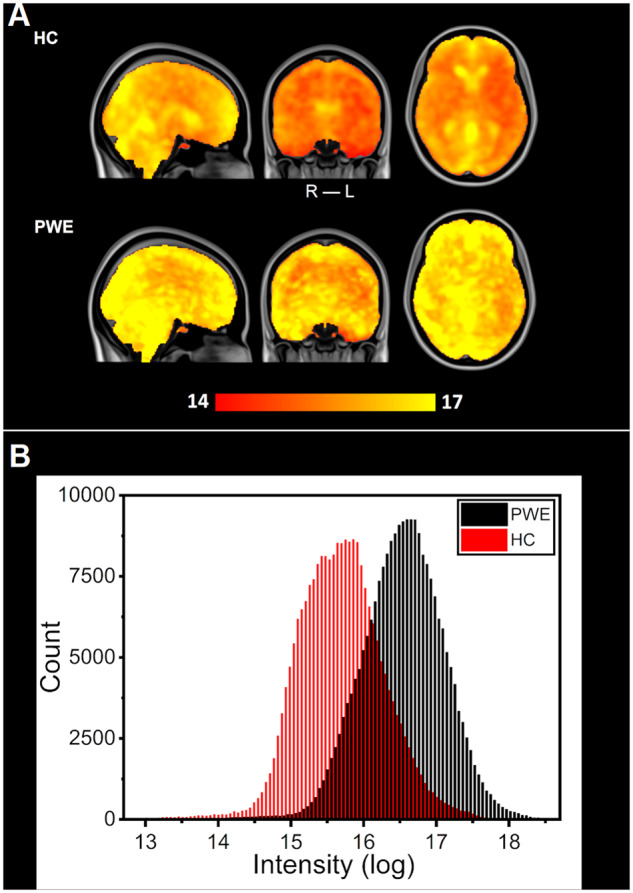
Figure 2.

Mean spectral power of brain pulsations between HC and PWE groups. (A) Group mean maps in respiration-related power, transformed into a logarithmic scale. PWE group mean values are larger in the whole brain compared to HC. (B) Distributions of mean power in the respiratory sub-band voxel values in each group calculated from maps of section (A). Despite an overlap between the two similar distributions (HC: red, PWE: black), difference between the groups is highly significant (P < 0.001).
