Figure 3.
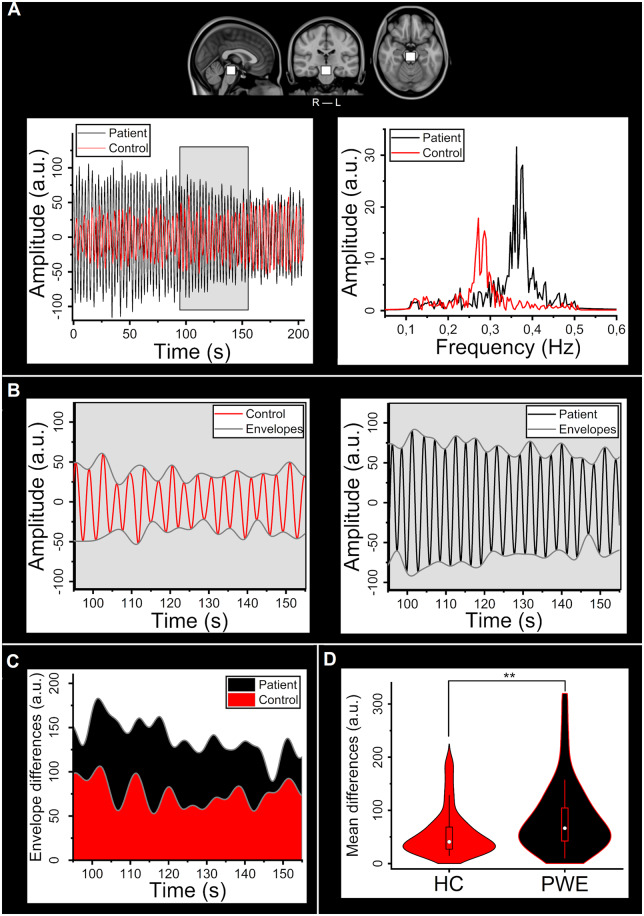
Differences in the respiratory bandpass filtered signal within the brainstem ROI. (A) The selected ROI in the upper brainstem area and example individual bandpass filtered signals from the PWE (black) and HC (red) groups and their respective frequency spectra. (B) Individual time-domain signals shown in A and corresponding individual lower and upper signal envelopes (control: red, patient: black). (C) Difference of envelopes (max−min) i.e. amplitude of signal for the example subjects (control: red, patient: black). (D) Violin plot of mean envelope differences between groups (HC: red, PWE: black). Groups differ significantly (P = 0.0035). ROI = region-of-interest.

